
Advertisement
- Hong Kong
- /
- Paper and Forestry Products
- /
- SEHK:2314
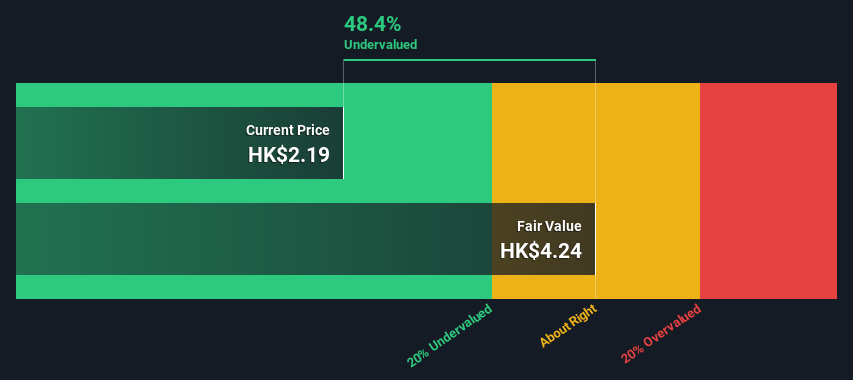
An Intrinsic Calculation For Lee & Man Paper Manufacturing Limited (HKG:2314) Suggests It's 48% Undervalued
Key Insights
- Using the 2 Stage Free Cash Flow to Equity, Lee & Man Paper Manufacturing fair value estimate is HK$4.24
- Lee & Man Paper Manufacturing is estimated to be 48% undervalued based on current share price of HK$2.19
- Analyst price target for 2314 is HK$2.96 which is 30% below our fair value estimate
Today we will run through one way of estimating the intrinsic value of Lee & Man Paper Manufacturing Limited (HKG:2314) by taking the expected future cash flows and discounting them to today's value. Our analysis will employ the Discounted Cash Flow (DCF) model. Believe it or not, it's not too difficult to follow, as you'll see from our example!
Companies can be valued in a lot of ways, so we would point out that a DCF is not perfect for every situation. If you still have some burning questions about this type of valuation, take a look at the Simply Wall St analysis model.
View our latest analysis for Lee & Man Paper Manufacturing
The Method
We use what is known as a 2-stage model, which simply means we have two different periods of growth rates for the company's cash flows. Generally the first stage is higher growth, and the second stage is a lower growth phase. To start off with, we need to estimate the next ten years of cash flows. Where possible we use analyst estimates, but when these aren't available we extrapolate the previous free cash flow (FCF) from the last estimate or reported value. We assume companies with shrinking free cash flow will slow their rate of shrinkage, and that companies with growing free cash flow will see their growth rate slow, over this period. We do this to reflect that growth tends to slow more in the early years than it does in later years.
Generally we assume that a dollar today is more valuable than a dollar in the future, and so the sum of these future cash flows is then discounted to today's value:
10-year free cash flow (FCF) forecast
| 2024 | 2025 | 2026 | 2027 | 2028 | 2029 | 2030 | 2031 | 2032 | 2033 | |
| Levered FCF (HK$, Millions) | HK$1.30b | HK$1.60b | HK$1.83b | HK$2.02b | HK$2.18b | HK$2.31b | HK$2.43b | HK$2.53b | HK$2.61b | HK$2.69b |
| Growth Rate Estimate Source | Analyst x2 | Analyst x2 | Est @ 14.08% | Est @ 10.47% | Est @ 7.94% | Est @ 6.17% | Est @ 4.93% | Est @ 4.06% | Est @ 3.46% | Est @ 3.03% |
| Present Value (HK$, Millions) Discounted @ 13% | HK$1.1k | HK$1.3k | HK$1.3k | HK$1.2k | HK$1.2k | HK$1.1k | HK$1.0k | HK$950 | HK$870 | HK$793 |
("Est" = FCF growth rate estimated by Simply Wall St)
Present Value of 10-year Cash Flow (PVCF) = HK$11b
After calculating the present value of future cash flows in the initial 10-year period, we need to calculate the Terminal Value, which accounts for all future cash flows beyond the first stage. For a number of reasons a very conservative growth rate is used that cannot exceed that of a country's GDP growth. In this case we have used the 5-year average of the 10-year government bond yield (2.0%) to estimate future growth. In the same way as with the 10-year 'growth' period, we discount future cash flows to today's value, using a cost of equity of 13%.
Terminal Value (TV)= FCF2033 × (1 + g) ÷ (r – g) = HK$2.7b× (1 + 2.0%) ÷ (13%– 2.0%) = HK$25b
Present Value of Terminal Value (PVTV)= TV / (1 + r)10= HK$25b÷ ( 1 + 13%)10= HK$7.4b
The total value is the sum of cash flows for the next ten years plus the discounted terminal value, which results in the Total Equity Value, which in this case is HK$18b. In the final step we divide the equity value by the number of shares outstanding. Compared to the current share price of HK$2.2, the company appears quite good value at a 48% discount to where the stock price trades currently. Valuations are imprecise instruments though, rather like a telescope - move a few degrees and end up in a different galaxy. Do keep this in mind.
The Assumptions
Now the most important inputs to a discounted cash flow are the discount rate, and of course, the actual cash flows. If you don't agree with these result, have a go at the calculation yourself and play with the assumptions. The DCF also does not consider the possible cyclicality of an industry, or a company's future capital requirements, so it does not give a full picture of a company's potential performance. Given that we are looking at Lee & Man Paper Manufacturing as potential shareholders, the cost of equity is used as the discount rate, rather than the cost of capital (or weighted average cost of capital, WACC) which accounts for debt. In this calculation we've used 13%, which is based on a levered beta of 2.000. Beta is a measure of a stock's volatility, compared to the market as a whole. We get our beta from the industry average beta of globally comparable companies, with an imposed limit between 0.8 and 2.0, which is a reasonable range for a stable business.
SWOT Analysis for Lee & Man Paper Manufacturing
Strength
- Debt is well covered by cash flow.
Weakness
- Earnings declined over the past year.
- Interest payments on debt are not well covered.
- Dividend is low compared to the top 25% of dividend payers in the Forestry market.
Opportunity
- Annual earnings are forecast to grow faster than the Hong Kong market.
- Trading below our estimate of fair value by more than 20%.
Threat
- Paying a dividend but company has no free cash flows.
- Annual revenue is forecast to grow slower than the Hong Kong market.
Looking Ahead:
Whilst important, the DCF calculation ideally won't be the sole piece of analysis you scrutinize for a company. DCF models are not the be-all and end-all of investment valuation. Rather it should be seen as a guide to "what assumptions need to be true for this stock to be under/overvalued?" If a company grows at a different rate, or if its cost of equity or risk free rate changes sharply, the output can look very different. Can we work out why the company is trading at a discount to intrinsic value? For Lee & Man Paper Manufacturing, there are three relevant elements you should further research:
- Risks: For instance, we've identified 2 warning signs for Lee & Man Paper Manufacturing (1 doesn't sit too well with us) you should be aware of.
- Future Earnings: How does 2314's growth rate compare to its peers and the wider market? Dig deeper into the analyst consensus number for the upcoming years by interacting with our free analyst growth expectation chart.
- Other Solid Businesses: Low debt, high returns on equity and good past performance are fundamental to a strong business. Why not explore our interactive list of stocks with solid business fundamentals to see if there are other companies you may not have considered!
PS. Simply Wall St updates its DCF calculation for every Hong Kong stock every day, so if you want to find the intrinsic value of any other stock just search here.
New: AI Stock Screener & Alerts
Our new AI Stock Screener scans the market every day to uncover opportunities.
• Dividend Powerhouses (3%+ Yield)
• Undervalued Small Caps with Insider Buying
• High growth Tech and AI Companies
Or build your own from over 50 metrics.
Have feedback on this article? Concerned about the content? Get in touch with us directly. Alternatively, email editorial-team (at) simplywallst.com.
This article by Simply Wall St is general in nature. We provide commentary based on historical data and analyst forecasts only using an unbiased methodology and our articles are not intended to be financial advice. It does not constitute a recommendation to buy or sell any stock, and does not take account of your objectives, or your financial situation. We aim to bring you long-term focused analysis driven by fundamental data. Note that our analysis may not factor in the latest price-sensitive company announcements or qualitative material. Simply Wall St has no position in any stocks mentioned.
About SEHK:2314
Lee & Man Paper Manufacturing
Engages in the manufacture and trading of packaging papers, pulps, and tissue papers in the People’s Republic of China, Vietnam, Malaysia, Macau, and Hong Kong.
Fair value with imperfect balance sheet.
Market Insights

Advertisement
Community Narratives
The company that turned a verb into a global necessity and basically runs the modern internet, digital ads, smartphones, maps, and AI.
Fair Value US$300.00|5.1% undervalued
OS
Community Contributor
Flowers Foods Pays A Fair Price For Health
Fair Value US$16.12|27.7% undervalued
NV
Community Contributor
TMX Group will thrive with 33.3% profit margin and enduring market moat
Fair Value CA$49.90|0.2% overvalued
LI
Community Contributor
The "Molecular Pencil": Why Beam's Technology is Built to Win
Fair Value US$65.01|64.4% undervalued
DA
Community Contributor