
Advertisement
- Hong Kong
- /
- Medical Equipment
- /
- SEHK:9996
Estimating The Intrinsic Value Of Peijia Medical Limited (HKG:9996)
Key Insights
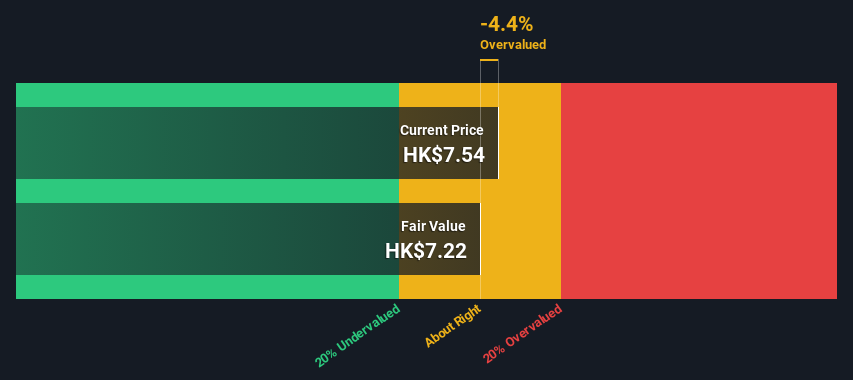
- The projected fair value for Peijia Medical is HK$7.22 based on 2 Stage Free Cash Flow to Equity
- With HK$7.54 share price, Peijia Medical appears to be trading close to its estimated fair value
- Our fair value estimate is 44% lower than Peijia Medical's analyst price target of CN¥13.01
In this article we are going to estimate the intrinsic value of Peijia Medical Limited (HKG:9996) by taking the expected future cash flows and discounting them to their present value. We will take advantage of the Discounted Cash Flow (DCF) model for this purpose. Believe it or not, it's not too difficult to follow, as you'll see from our example!
We would caution that there are many ways of valuing a company and, like the DCF, each technique has advantages and disadvantages in certain scenarios. If you want to learn more about discounted cash flow, the rationale behind this calculation can be read in detail in the Simply Wall St analysis model.
View our latest analysis for Peijia Medical
The Model
We are going to use a two-stage DCF model, which, as the name states, takes into account two stages of growth. The first stage is generally a higher growth period which levels off heading towards the terminal value, captured in the second 'steady growth' period. To begin with, we have to get estimates of the next ten years of cash flows. Where possible we use analyst estimates, but when these aren't available we extrapolate the previous free cash flow (FCF) from the last estimate or reported value. We assume companies with shrinking free cash flow will slow their rate of shrinkage, and that companies with growing free cash flow will see their growth rate slow, over this period. We do this to reflect that growth tends to slow more in the early years than it does in later years.
Generally we assume that a dollar today is more valuable than a dollar in the future, and so the sum of these future cash flows is then discounted to today's value:
10-year free cash flow (FCF) forecast
| 2024 | 2025 | 2026 | 2027 | 2028 | 2029 | 2030 | 2031 | 2032 | 2033 | |
| Levered FCF (CN¥, Millions) | -CN¥497.0m | -CN¥288.0m | -CN¥196.0m | CN¥121.5m | CN¥182.4m | CN¥247.4m | CN¥310.6m | CN¥367.9m | CN¥417.7m | CN¥459.7m |
| Growth Rate Estimate Source | Analyst x3 | Analyst x2 | Analyst x1 | Analyst x2 | Est @ 50.08% | Est @ 35.65% | Est @ 25.55% | Est @ 18.47% | Est @ 13.52% | Est @ 10.06% |
| Present Value (CN¥, Millions) Discounted @ 7.5% | -CN¥462 | -CN¥249 | -CN¥158 | CN¥91.0 | CN¥127 | CN¥160 | CN¥187 | CN¥206 | CN¥218 | CN¥223 |
("Est" = FCF growth rate estimated by Simply Wall St)
Present Value of 10-year Cash Flow (PVCF) = CN¥343m
The second stage is also known as Terminal Value, this is the business's cash flow after the first stage. The Gordon Growth formula is used to calculate Terminal Value at a future annual growth rate equal to the 5-year average of the 10-year government bond yield of 2.0%. We discount the terminal cash flows to today's value at a cost of equity of 7.5%.
Terminal Value (TV)= FCF2033 × (1 + g) ÷ (r – g) = CN¥460m× (1 + 2.0%) ÷ (7.5%– 2.0%) = CN¥8.5b
Present Value of Terminal Value (PVTV)= TV / (1 + r)10= CN¥8.5b÷ ( 1 + 7.5%)10= CN¥4.1b
The total value is the sum of cash flows for the next ten years plus the discounted terminal value, which results in the Total Equity Value, which in this case is CN¥4.5b. To get the intrinsic value per share, we divide this by the total number of shares outstanding. Relative to the current share price of HK$7.5, the company appears around fair value at the time of writing. Valuations are imprecise instruments though, rather like a telescope - move a few degrees and end up in a different galaxy. Do keep this in mind.
The Assumptions
Now the most important inputs to a discounted cash flow are the discount rate, and of course, the actual cash flows. If you don't agree with these result, have a go at the calculation yourself and play with the assumptions. The DCF also does not consider the possible cyclicality of an industry, or a company's future capital requirements, so it does not give a full picture of a company's potential performance. Given that we are looking at Peijia Medical as potential shareholders, the cost of equity is used as the discount rate, rather than the cost of capital (or weighted average cost of capital, WACC) which accounts for debt. In this calculation we've used 7.5%, which is based on a levered beta of 0.911. Beta is a measure of a stock's volatility, compared to the market as a whole. We get our beta from the industry average beta of globally comparable companies, with an imposed limit between 0.8 and 2.0, which is a reasonable range for a stable business.
SWOT Analysis for Peijia Medical
Strength
- Debt is well covered by earnings.
Weakness
- No major weaknesses identified for 9996.
Opportunity
- Forecast to reduce losses next year.
- Good value based on P/S ratio compared to estimated Fair P/S ratio.
Threat
- Debt is not well covered by operating cash flow.
- Has less than 3 years of cash runway based on current free cash flow.
- Not expected to become profitable over the next 3 years.
Looking Ahead:
Whilst important, the DCF calculation ideally won't be the sole piece of analysis you scrutinize for a company. DCF models are not the be-all and end-all of investment valuation. Preferably you'd apply different cases and assumptions and see how they would impact the company's valuation. For instance, if the terminal value growth rate is adjusted slightly, it can dramatically alter the overall result. For Peijia Medical, there are three further factors you should further examine:
- Risks: We feel that you should assess the 1 warning sign for Peijia Medical we've flagged before making an investment in the company.
- Future Earnings: How does 9996's growth rate compare to its peers and the wider market? Dig deeper into the analyst consensus number for the upcoming years by interacting with our free analyst growth expectation chart.
- Other Solid Businesses: Low debt, high returns on equity and good past performance are fundamental to a strong business. Why not explore our interactive list of stocks with solid business fundamentals to see if there are other companies you may not have considered!
PS. The Simply Wall St app conducts a discounted cash flow valuation for every stock on the SEHK every day. If you want to find the calculation for other stocks just search here.
New: Manage All Your Stock Portfolios in One Place
We've created the ultimate portfolio companion for stock investors, and it's free.
• Connect an unlimited number of Portfolios and see your total in one currency
• Be alerted to new Warning Signs or Risks via email or mobile
• Track the Fair Value of your stocks
Have feedback on this article? Concerned about the content? Get in touch with us directly. Alternatively, email editorial-team (at) simplywallst.com.
This article by Simply Wall St is general in nature. We provide commentary based on historical data and analyst forecasts only using an unbiased methodology and our articles are not intended to be financial advice. It does not constitute a recommendation to buy or sell any stock, and does not take account of your objectives, or your financial situation. We aim to bring you long-term focused analysis driven by fundamental data. Note that our analysis may not factor in the latest price-sensitive company announcements or qualitative material. Simply Wall St has no position in any stocks mentioned.
About SEHK:9996
Peijia Medical
Engages in the research, development, manufacturing, and sales of transcatheter valve therapeutic and neurointerventional procedural medical devices in the People’s Republic of China.
Undervalued with high growth potential.
Market Insights

Advertisement
Community Narratives
The company that turned a verb into a global necessity and basically runs the modern internet, digital ads, smartphones, maps, and AI.
Fair Value US$300.00|6.3% undervalued
OS
Community Contributor
Flowers Foods Pays A Fair Price For Health
Fair Value US$16.12|26.0% undervalued
NV
Community Contributor
TMX Group will thrive with 33.3% profit margin and enduring market moat
Fair Value CA$49.90|3.7% overvalued
LI
Community Contributor