
Advertisement
- Hong Kong
- /
- Healthcare Services
- /
- SEHK:401
Wanjia Group Holdings Limited (HKG:401) Held Back By Insufficient Growth Even After Shares Climb 53%
Despite an already strong run, Wanjia Group Holdings Limited (HKG:401) shares have been powering on, with a gain of 53% in the last thirty days. The last 30 days bring the annual gain to a very sharp 89%.
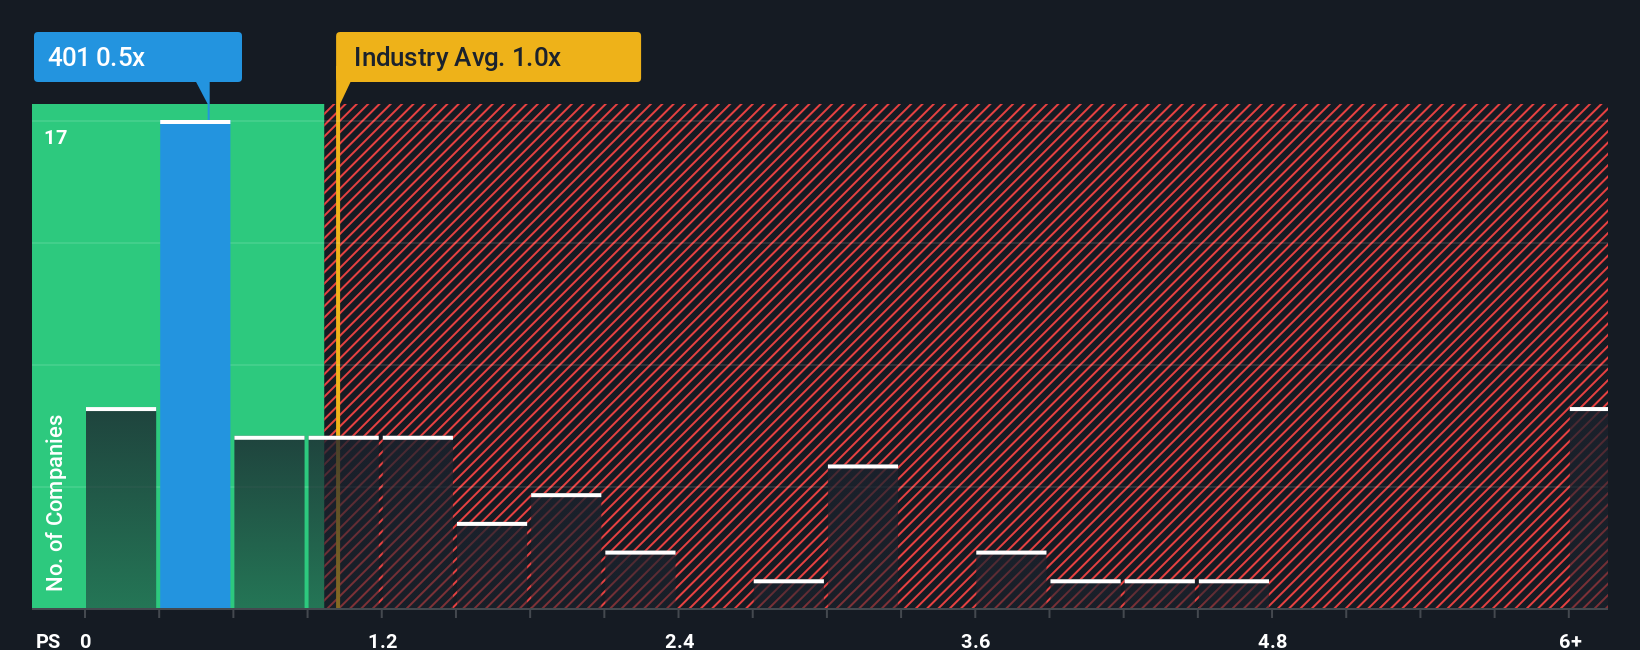
In spite of the firm bounce in price, when close to half the companies operating in Hong Kong's Healthcare industry have price-to-sales ratios (or "P/S") above 1x, you may still consider Wanjia Group Holdings as an enticing stock to check out with its 0.5x P/S ratio. However, the P/S might be low for a reason and it requires further investigation to determine if it's justified.
See our latest analysis for Wanjia Group Holdings
What Does Wanjia Group Holdings' Recent Performance Look Like?
For example, consider that Wanjia Group Holdings' financial performance has been poor lately as its revenue has been in decline. It might be that many expect the disappointing revenue performance to continue or accelerate, which has repressed the P/S. Those who are bullish on Wanjia Group Holdings will be hoping that this isn't the case so that they can pick up the stock at a lower valuation.
We don't have analyst forecasts, but you can see how recent trends are setting up the company for the future by checking out our free report on Wanjia Group Holdings' earnings, revenue and cash flow.How Is Wanjia Group Holdings' Revenue Growth Trending?
There's an inherent assumption that a company should underperform the industry for P/S ratios like Wanjia Group Holdings' to be considered reasonable.
Retrospectively, the last year delivered a frustrating 11% decrease to the company's top line. Unfortunately, that's brought it right back to where it started three years ago with revenue growth being virtually non-existent overall during that time. Therefore, it's fair to say that revenue growth has been inconsistent recently for the company.
Comparing the recent medium-term revenue trends against the industry's one-year growth forecast of 11% shows it's noticeably less attractive.
With this in consideration, it's easy to understand why Wanjia Group Holdings' P/S falls short of the mark set by its industry peers. It seems most investors are expecting to see the recent limited growth rates continue into the future and are only willing to pay a reduced amount for the stock.
What Does Wanjia Group Holdings' P/S Mean For Investors?
Wanjia Group Holdings' stock price has surged recently, but its but its P/S still remains modest. While the price-to-sales ratio shouldn't be the defining factor in whether you buy a stock or not, it's quite a capable barometer of revenue expectations.
As we suspected, our examination of Wanjia Group Holdings revealed its three-year revenue trends are contributing to its low P/S, given they look worse than current industry expectations. Right now shareholders are accepting the low P/S as they concede future revenue probably won't provide any pleasant surprises. Unless the recent medium-term conditions improve, they will continue to form a barrier for the share price around these levels.
It's always necessary to consider the ever-present spectre of investment risk. We've identified 3 warning signs with Wanjia Group Holdings (at least 2 which don't sit too well with us), and understanding these should be part of your investment process.
If you're unsure about the strength of Wanjia Group Holdings' business, why not explore our interactive list of stocks with solid business fundamentals for some other companies you may have missed.
Valuation is complex, but we're here to simplify it.
Discover if Wanjia Group Holdings might be undervalued or overvalued with our detailed analysis, featuring fair value estimates, potential risks, dividends, insider trades, and its financial condition.
Access Free AnalysisHave feedback on this article? Concerned about the content? Get in touch with us directly. Alternatively, email editorial-team (at) simplywallst.com.
This article by Simply Wall St is general in nature. We provide commentary based on historical data and analyst forecasts only using an unbiased methodology and our articles are not intended to be financial advice. It does not constitute a recommendation to buy or sell any stock, and does not take account of your objectives, or your financial situation. We aim to bring you long-term focused analysis driven by fundamental data. Note that our analysis may not factor in the latest price-sensitive company announcements or qualitative material. Simply Wall St has no position in any stocks mentioned.
About SEHK:401
Wanjia Group Holdings
An investment holding company, engages in the wholesale and distribution pharmaceutical business in the Mainland China and Hong Kong.
Flawless balance sheet and good value.
Market Insights

Advertisement
Community Narratives
The company that turned a verb into a global necessity and basically runs the modern internet, digital ads, smartphones, maps, and AI.
Fair Value US$300.00|5.4% undervalued
OS
Community Contributor
Flowers Foods Pays A Fair Price For Health
Fair Value US$16.12|26.3% undervalued
NV
Community Contributor
TMX Group will thrive with 33.3% profit margin and enduring market moat
Fair Value CA$49.90|4.1% overvalued
LI
Community Contributor