
Advertisement
- Hong Kong
- /
- Healthcare Services
- /
- SEHK:2273
What You Can Learn From Gushengtang Holdings Limited's (HKG:2273) P/E After Its 28% Share Price Crash
The Gushengtang Holdings Limited (HKG:2273) share price has softened a substantial 28% over the previous 30 days, handing back much of the gains the stock has made lately. Instead of being rewarded, shareholders who have already held through the last twelve months are now sitting on a 24% share price drop.
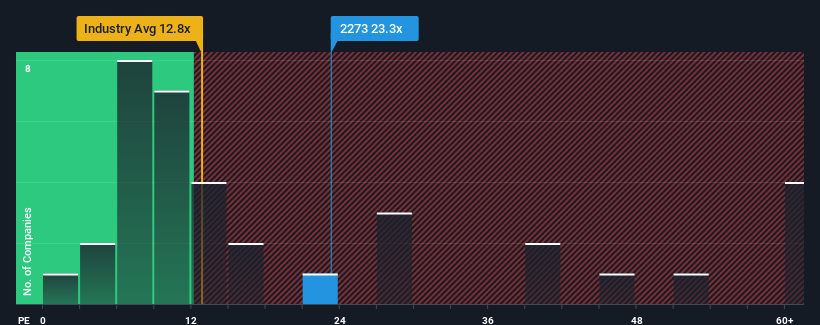
In spite of the heavy fall in price, Gushengtang Holdings' price-to-earnings (or "P/E") ratio of 23.3x might still make it look like a strong sell right now compared to the market in Hong Kong, where around half of the companies have P/E ratios below 10x and even P/E's below 6x are quite common. Although, it's not wise to just take the P/E at face value as there may be an explanation why it's so lofty.
With earnings growth that's superior to most other companies of late, Gushengtang Holdings has been doing relatively well. The P/E is probably high because investors think this strong earnings performance will continue. If not, then existing shareholders might be a little nervous about the viability of the share price.
Check out our latest analysis for Gushengtang Holdings
Does Growth Match The High P/E?
There's an inherent assumption that a company should far outperform the market for P/E ratios like Gushengtang Holdings' to be considered reasonable.
If we review the last year of earnings growth, the company posted a terrific increase of 19%. However, the latest three year period hasn't been as great in aggregate as it didn't manage to provide any growth at all. So it appears to us that the company has had a mixed result in terms of growing earnings over that time.
Shifting to the future, estimates from the analysts covering the company suggest earnings should grow by 25% per year over the next three years. With the market only predicted to deliver 14% per annum, the company is positioned for a stronger earnings result.
With this information, we can see why Gushengtang Holdings is trading at such a high P/E compared to the market. Apparently shareholders aren't keen to offload something that is potentially eyeing a more prosperous future.
The Bottom Line On Gushengtang Holdings' P/E
A significant share price dive has done very little to deflate Gushengtang Holdings' very lofty P/E. We'd say the price-to-earnings ratio's power isn't primarily as a valuation instrument but rather to gauge current investor sentiment and future expectations.
As we suspected, our examination of Gushengtang Holdings' analyst forecasts revealed that its superior earnings outlook is contributing to its high P/E. At this stage investors feel the potential for a deterioration in earnings isn't great enough to justify a lower P/E ratio. Unless these conditions change, they will continue to provide strong support to the share price.
Plus, you should also learn about this 1 warning sign we've spotted with Gushengtang Holdings .
Of course, you might also be able to find a better stock than Gushengtang Holdings. So you may wish to see this free collection of other companies that have reasonable P/E ratios and have grown earnings strongly.
New: Manage All Your Stock Portfolios in One Place
We've created the ultimate portfolio companion for stock investors, and it's free.
• Connect an unlimited number of Portfolios and see your total in one currency
• Be alerted to new Warning Signs or Risks via email or mobile
• Track the Fair Value of your stocks
Have feedback on this article? Concerned about the content? Get in touch with us directly. Alternatively, email editorial-team (at) simplywallst.com.
This article by Simply Wall St is general in nature. We provide commentary based on historical data and analyst forecasts only using an unbiased methodology and our articles are not intended to be financial advice. It does not constitute a recommendation to buy or sell any stock, and does not take account of your objectives, or your financial situation. We aim to bring you long-term focused analysis driven by fundamental data. Note that our analysis may not factor in the latest price-sensitive company announcements or qualitative material. Simply Wall St has no position in any stocks mentioned.
About SEHK:2273
Gushengtang Holdings
An investment holding company, provides healthcare services in the People’s Republic of China.
Flawless balance sheet and good value.
Market Insights

Advertisement
Community Narratives
MicroVision will explode future revenue by 380.37% with a vision towards success
Fair Value US$60.00|98.4% undervalued
TH
Community Contributor
The Indispensable Artery for a New North American Economy
Fair Value CA$132.87|1.3% undervalued
TI
Community Contributor