
Advertisement
Legendary fund manager Li Lu (who Charlie Munger backed) once said, 'The biggest investment risk is not the volatility of prices, but whether you will suffer a permanent loss of capital.' So it might be obvious that you need to consider debt, when you think about how risky any given stock is, because too much debt can sink a company. We note that Sisram Medical Ltd (HKG:1696) does have debt on its balance sheet. But should shareholders be worried about its use of debt?
When Is Debt Dangerous?
Debt is a tool to help businesses grow, but if a business is incapable of paying off its lenders, then it exists at their mercy. In the worst case scenario, a company can go bankrupt if it cannot pay its creditors. However, a more common (but still painful) scenario is that it has to raise new equity capital at a low price, thus permanently diluting shareholders. Of course, the upside of debt is that it often represents cheap capital, especially when it replaces dilution in a company with the ability to reinvest at high rates of return. The first step when considering a company's debt levels is to consider its cash and debt together.
See our latest analysis for Sisram Medical
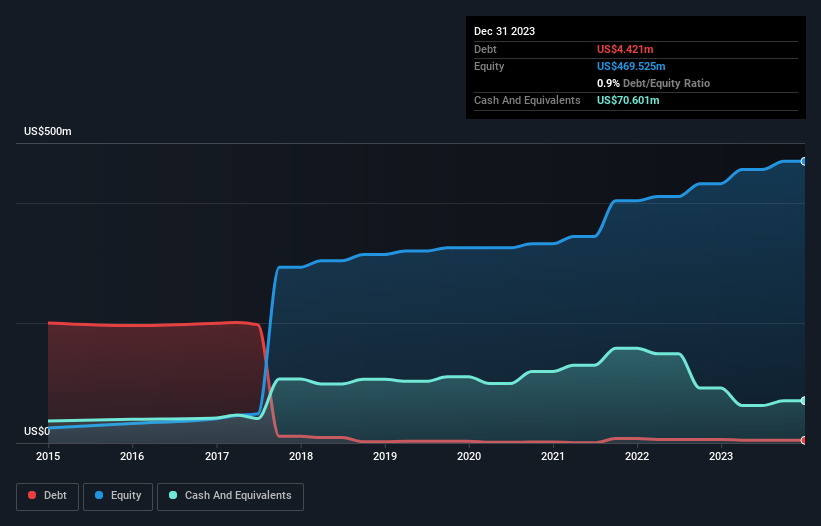
What Is Sisram Medical's Net Debt?
As you can see below, Sisram Medical had US$4.42m of debt at December 2023, down from US$5.74m a year prior. But it also has US$70.6m in cash to offset that, meaning it has US$66.2m net cash.
How Healthy Is Sisram Medical's Balance Sheet?
The latest balance sheet data shows that Sisram Medical had liabilities of US$88.3m due within a year, and liabilities of US$55.7m falling due after that. On the other hand, it had cash of US$70.6m and US$83.5m worth of receivables due within a year. So it can boast US$10.1m more liquid assets than total liabilities.
This surplus suggests that Sisram Medical has a conservative balance sheet, and could probably eliminate its debt without much difficulty. Succinctly put, Sisram Medical boasts net cash, so it's fair to say it does not have a heavy debt load!
On the other hand, Sisram Medical's EBIT dived 16%, over the last year. If that rate of decline in earnings continues, the company could find itself in a tight spot. The balance sheet is clearly the area to focus on when you are analysing debt. But ultimately the future profitability of the business will decide if Sisram Medical can strengthen its balance sheet over time. So if you're focused on the future you can check out this free report showing analyst profit forecasts.
Finally, a business needs free cash flow to pay off debt; accounting profits just don't cut it. Sisram Medical may have net cash on the balance sheet, but it is still interesting to look at how well the business converts its earnings before interest and tax (EBIT) to free cash flow, because that will influence both its need for, and its capacity to manage debt. Over the last three years, Sisram Medical reported free cash flow worth 18% of its EBIT, which is really quite low. That limp level of cash conversion undermines its ability to manage and pay down debt.
Summing Up
While it is always sensible to investigate a company's debt, in this case Sisram Medical has US$66.2m in net cash and a decent-looking balance sheet. So we don't have any problem with Sisram Medical's use of debt. The balance sheet is clearly the area to focus on when you are analysing debt. However, not all investment risk resides within the balance sheet - far from it. For example - Sisram Medical has 1 warning sign we think you should be aware of.
Of course, if you're the type of investor who prefers buying stocks without the burden of debt, then don't hesitate to discover our exclusive list of net cash growth stocks, today.
New: Manage All Your Stock Portfolios in One Place
We've created the ultimate portfolio companion for stock investors, and it's free.
• Connect an unlimited number of Portfolios and see your total in one currency
• Be alerted to new Warning Signs or Risks via email or mobile
• Track the Fair Value of your stocks
Have feedback on this article? Concerned about the content? Get in touch with us directly. Alternatively, email editorial-team (at) simplywallst.com.
This article by Simply Wall St is general in nature. We provide commentary based on historical data and analyst forecasts only using an unbiased methodology and our articles are not intended to be financial advice. It does not constitute a recommendation to buy or sell any stock, and does not take account of your objectives, or your financial situation. We aim to bring you long-term focused analysis driven by fundamental data. Note that our analysis may not factor in the latest price-sensitive company announcements or qualitative material. Simply Wall St has no position in any stocks mentioned.
About SEHK:1696
Sisram Medical
Engages in the research, design, development, manufacture, sale, and marketing of medical aesthetics and dental equipment, home use devices, injectables, and cosmeceuticals products in the Asia Pacific, Europe, North America, Latin America, the Middle East, and Africa.
Excellent balance sheet with reasonable growth potential.
Similar Companies
Market Insights

Advertisement
Community Narratives
MicroVision will explode future revenue by 380.37% with a vision towards success
Fair Value US$60.00|98.4% undervalued
TH
Community Contributor
The Indispensable Artery for a New North American Economy
Fair Value CA$132.87|3.6% undervalued
TI
Community Contributor