- Hong Kong
- /
- Medical Equipment
- /
- SEHK:1696
9.3% earnings growth over 3 years has not materialized into gains for Sisram Medical (HKG:1696) shareholders over that period


Sisram Medical Ltd (HKG:1696) shareholders should be happy to see the share price up 10% in the last month. But the last three years have seen a terrible decline. Indeed, the share price is down a whopping 81% in the last three years. So it sure is nice to see a bit of an improvement. The thing to think about is whether the business has really turned around. While a drop like that is definitely a body blow, money isn't as important as health and happiness.
With the stock having lost 10% in the past week, it's worth taking a look at business performance and seeing if there's any red flags.
View our latest analysis for Sisram Medical
To paraphrase Benjamin Graham: Over the short term the market is a voting machine, but over the long term it's a weighing machine. By comparing earnings per share (EPS) and share price changes over time, we can get a feel for how investor attitudes to a company have morphed over time.
During the unfortunate three years of share price decline, Sisram Medical actually saw its earnings per share (EPS) improve by 31% per year. This is quite a puzzle, and suggests there might be something temporarily buoying the share price. Or else the company was over-hyped in the past, and so its growth has disappointed.
It's worth taking a look at other metrics, because the EPS growth doesn't seem to match with the falling share price.
We note that the dividend seems healthy enough, so that probably doesn't explain the share price drop. It's good to see that Sisram Medical has increased its revenue over the last three years. But it's not clear to us why the share price is down. It might be worth diving deeper into the fundamentals, lest an opportunity goes begging.
The graphic below depicts how earnings and revenue have changed over time (unveil the exact values by clicking on the image).
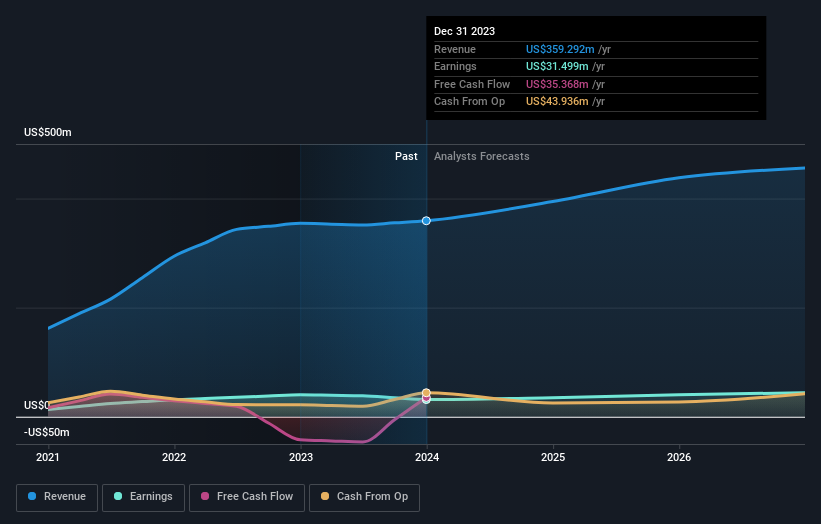
It is of course excellent to see how Sisram Medical has grown profits over the years, but the future is more important for shareholders. You can see how its balance sheet has strengthened (or weakened) over time in this free interactive graphic.
A Different Perspective
While the broader market gained around 7.7% in the last year, Sisram Medical shareholders lost 58% (even including dividends). However, keep in mind that even the best stocks will sometimes underperform the market over a twelve month period. On the bright side, long term shareholders have made money, with a gain of 1.6% per year over half a decade. It could be that the recent sell-off is an opportunity, so it may be worth checking the fundamental data for signs of a long term growth trend. It's always interesting to track share price performance over the longer term. But to understand Sisram Medical better, we need to consider many other factors. Consider risks, for instance. Every company has them, and we've spotted 1 warning sign for Sisram Medical you should know about.
If you would prefer to check out another company -- one with potentially superior financials -- then do not miss this free list of companies that have proven they can grow earnings.
Please note, the market returns quoted in this article reflect the market weighted average returns of stocks that currently trade on Hong Kong exchanges.
New: Manage All Your Stock Portfolios in One Place
We've created the ultimate portfolio companion for stock investors, and it's free.
• Connect an unlimited number of Portfolios and see your total in one currency
• Be alerted to new Warning Signs or Risks via email or mobile
• Track the Fair Value of your stocks
Have feedback on this article? Concerned about the content? Get in touch with us directly. Alternatively, email editorial-team (at) simplywallst.com.
This article by Simply Wall St is general in nature. We provide commentary based on historical data and analyst forecasts only using an unbiased methodology and our articles are not intended to be financial advice. It does not constitute a recommendation to buy or sell any stock, and does not take account of your objectives, or your financial situation. We aim to bring you long-term focused analysis driven by fundamental data. Note that our analysis may not factor in the latest price-sensitive company announcements or qualitative material. Simply Wall St has no position in any stocks mentioned.
About SEHK:1696
Sisram Medical
Engages in the research, design, development, manufacture, and sales of medical aesthetics and dental equipment, home use devices, injectables, and cosmeceuticals products in the Asia Pacific, Europe, North America, Latin America, the Middle East, and Africa.
Undervalued with excellent balance sheet.
