
Advertisement
- Hong Kong
- /
- Oil and Gas
- /
- SEHK:8270
Take Care Before Jumping Onto China CBM Group Company Limited (HKG:8270) Even Though It's 33% Cheaper
China CBM Group Company Limited (HKG:8270) shares have had a horrible month, losing 33% after a relatively good period beforehand. The drop over the last 30 days has capped off a tough year for shareholders, with the share price down 41% in that time.
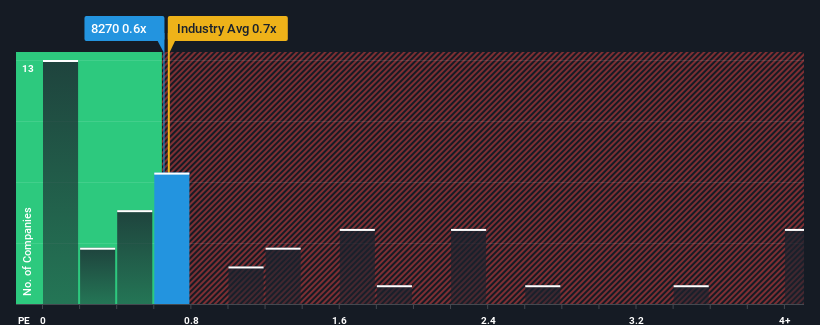
Although its price has dipped substantially, you could still be forgiven for feeling indifferent about China CBM Group's P/S ratio of 0.6x, since the median price-to-sales (or "P/S") ratio for the Oil and Gas industry in Hong Kong is also close to 0.7x. Although, it's not wise to simply ignore the P/S without explanation as investors may be disregarding a distinct opportunity or a costly mistake.
Check out our latest analysis for China CBM Group
How China CBM Group Has Been Performing
For instance, China CBM Group's receding revenue in recent times would have to be some food for thought. Perhaps investors believe the recent revenue performance is enough to keep in line with the industry, which is keeping the P/S from dropping off. If you like the company, you'd at least be hoping this is the case so that you could potentially pick up some stock while it's not quite in favour.
We don't have analyst forecasts, but you can see how recent trends are setting up the company for the future by checking out our free report on China CBM Group's earnings, revenue and cash flow.How Is China CBM Group's Revenue Growth Trending?
The only time you'd be comfortable seeing a P/S like China CBM Group's is when the company's growth is tracking the industry closely.
Retrospectively, the last year delivered a frustrating 27% decrease to the company's top line. Still, the latest three year period has seen an excellent 34% overall rise in revenue, in spite of its unsatisfying short-term performance. So we can start by confirming that the company has generally done a very good job of growing revenue over that time, even though it had some hiccups along the way.
When compared to the industry's one-year growth forecast of 2.1%, the most recent medium-term revenue trajectory is noticeably more alluring
With this information, we find it interesting that China CBM Group is trading at a fairly similar P/S compared to the industry. It may be that most investors are not convinced the company can maintain its recent growth rates.
What We Can Learn From China CBM Group's P/S?
With its share price dropping off a cliff, the P/S for China CBM Group looks to be in line with the rest of the Oil and Gas industry. We'd say the price-to-sales ratio's power isn't primarily as a valuation instrument but rather to gauge current investor sentiment and future expectations.
To our surprise, China CBM Group revealed its three-year revenue trends aren't contributing to its P/S as much as we would have predicted, given they look better than current industry expectations. It'd be fair to assume that potential risks the company faces could be the contributing factor to the lower than expected P/S. It appears some are indeed anticipating revenue instability, because the persistence of these recent medium-term conditions would normally provide a boost to the share price.
Don't forget that there may be other risks. For instance, we've identified 5 warning signs for China CBM Group (2 can't be ignored) you should be aware of.
If companies with solid past earnings growth is up your alley, you may wish to see this free collection of other companies with strong earnings growth and low P/E ratios.
New: AI Stock Screener & Alerts
Our new AI Stock Screener scans the market every day to uncover opportunities.
• Dividend Powerhouses (3%+ Yield)
• Undervalued Small Caps with Insider Buying
• High growth Tech and AI Companies
Or build your own from over 50 metrics.
Have feedback on this article? Concerned about the content? Get in touch with us directly. Alternatively, email editorial-team (at) simplywallst.com.
This article by Simply Wall St is general in nature. We provide commentary based on historical data and analyst forecasts only using an unbiased methodology and our articles are not intended to be financial advice. It does not constitute a recommendation to buy or sell any stock, and does not take account of your objectives, or your financial situation. We aim to bring you long-term focused analysis driven by fundamental data. Note that our analysis may not factor in the latest price-sensitive company announcements or qualitative material. Simply Wall St has no position in any stocks mentioned.
Have feedback on this article? Concerned about the content? Get in touch with us directly. Alternatively, email editorial-team@simplywallst.com
About SEHK:8270
China CBM Group
An investment holding company, engages in the exploitation, liquefaction production, and sale of natural gas and coalbed gas in the People’s Republic of China.
Mediocre balance sheet and slightly overvalued.
Market Insights

Advertisement
Community Narratives
The "Molecular Pencil": Why Beam's Technology is Built to Win
Fair Value US$65.01|66.7% undervalued
DA
Community Contributor
The silent giant behind virtually every advanced chip powering AI, smartphones, and modern infrastructure.
Fair Value US$310.00|4.8% undervalued
OS
Community Contributor
ADP Stock: Solid Fundamentals, But AI Investments Test Its Margin Resilience
Fair Value US$387.77|34.5% undervalued
YI
Community Contributor
MINISO's fair value is projected at 26.69 with an anticipated PE ratio shift of 20x
Fair Value US$24.03|9.6% undervalued
BE
Community Contributor