- Hong Kong
- /
- Oil and Gas
- /
- SEHK:1898
China Coal Energy (HKG:1898) stock performs better than its underlying earnings growth over last three years

The most you can lose on any stock (assuming you don't use leverage) is 100% of your money. But when you pick a company that is really flourishing, you can make more than 100%. For instance the China Coal Energy Company Limited (HKG:1898) share price is 282% higher than it was three years ago. Most would be happy with that. Also pleasing for shareholders was the 42% gain in the last three months.
The past week has proven to be lucrative for China Coal Energy investors, so let's see if fundamentals drove the company's three-year performance.
See our latest analysis for China Coal Energy
To quote Buffett, 'Ships will sail around the world but the Flat Earth Society will flourish. There will continue to be wide discrepancies between price and value in the marketplace...' One flawed but reasonable way to assess how sentiment around a company has changed is to compare the earnings per share (EPS) with the share price.
China Coal Energy was able to grow its EPS at 57% per year over three years, sending the share price higher. This EPS growth is remarkably close to the 56% average annual increase in the share price. That suggests that the market sentiment around the company hasn't changed much over that time. Au contraire, the share price change has arguably mimicked the EPS growth.
You can see below how EPS has changed over time (discover the exact values by clicking on the image).
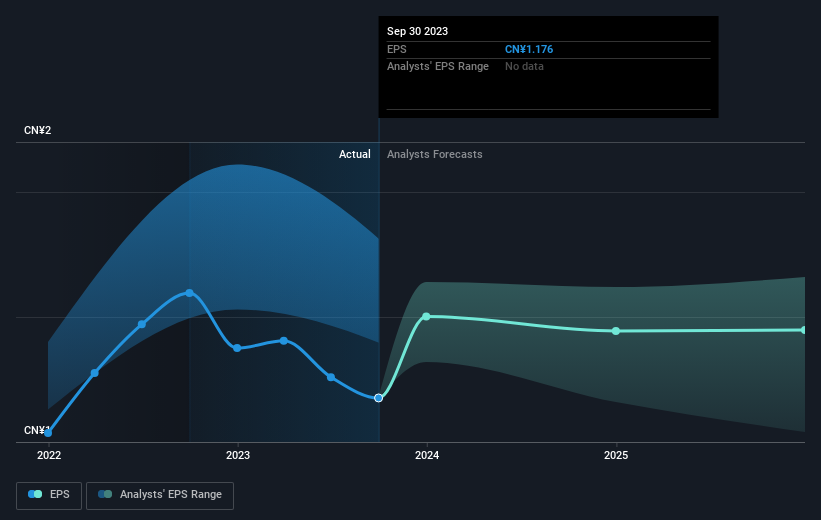
We know that China Coal Energy has improved its bottom line over the last three years, but what does the future have in store? This free interactive report on China Coal Energy's balance sheet strength is a great place to start, if you want to investigate the stock further.
What About Dividends?
It is important to consider the total shareholder return, as well as the share price return, for any given stock. The TSR is a return calculation that accounts for the value of cash dividends (assuming that any dividend received was reinvested) and the calculated value of any discounted capital raisings and spin-offs. So for companies that pay a generous dividend, the TSR is often a lot higher than the share price return. In the case of China Coal Energy, it has a TSR of 347% for the last 3 years. That exceeds its share price return that we previously mentioned. This is largely a result of its dividend payments!
A Different Perspective
It's nice to see that China Coal Energy shareholders have received a total shareholder return of 43% over the last year. And that does include the dividend. That's better than the annualised return of 27% over half a decade, implying that the company is doing better recently. Given the share price momentum remains strong, it might be worth taking a closer look at the stock, lest you miss an opportunity. I find it very interesting to look at share price over the long term as a proxy for business performance. But to truly gain insight, we need to consider other information, too. Consider for instance, the ever-present spectre of investment risk. We've identified 1 warning sign with China Coal Energy , and understanding them should be part of your investment process.
Of course, you might find a fantastic investment by looking elsewhere. So take a peek at this free list of companies we expect will grow earnings.
Please note, the market returns quoted in this article reflect the market weighted average returns of stocks that currently trade on Hong Kong exchanges.
New: AI Stock Screener & Alerts
Our new AI Stock Screener scans the market every day to uncover opportunities.
• Dividend Powerhouses (3%+ Yield)
• Undervalued Small Caps with Insider Buying
• High growth Tech and AI Companies
Or build your own from over 50 metrics.
Have feedback on this article? Concerned about the content? Get in touch with us directly. Alternatively, email editorial-team (at) simplywallst.com.
This article by Simply Wall St is general in nature. We provide commentary based on historical data and analyst forecasts only using an unbiased methodology and our articles are not intended to be financial advice. It does not constitute a recommendation to buy or sell any stock, and does not take account of your objectives, or your financial situation. We aim to bring you long-term focused analysis driven by fundamental data. Note that our analysis may not factor in the latest price-sensitive company announcements or qualitative material. Simply Wall St has no position in any stocks mentioned.
About SEHK:1898
China Coal Energy
China Coal Energy Company Limited mines, produces, processes, trades in, and sells coal in the People’s Republic of China and internationally.
Very undervalued with flawless balance sheet and pays a dividend.
