
Advertisement
- Hong Kong
- /
- Consumer Services
- /
- SEHK:2262
The Trends At Steve Leung Design Group (HKG:2262) That You Should Know About
Finding a business that has the potential to grow substantially is not easy, but it is possible if we look at a few key financial metrics. In a perfect world, we'd like to see a company investing more capital into its business and ideally the returns earned from that capital are also increasing. Basically this means that a company has profitable initiatives that it can continue to reinvest in, which is a trait of a compounding machine. In light of that, when we looked at Steve Leung Design Group (HKG:2262) and its ROCE trend, we weren't exactly thrilled.
What is Return On Capital Employed (ROCE)?
Just to clarify if you're unsure, ROCE is a metric for evaluating how much pre-tax income (in percentage terms) a company earns on the capital invested in its business. The formula for this calculation on Steve Leung Design Group is:
Return on Capital Employed = Earnings Before Interest and Tax (EBIT) ÷ (Total Assets - Current Liabilities)
0.13 = HK$65m ÷ (HK$687m - HK$185m) (Based on the trailing twelve months to June 2020).
Therefore, Steve Leung Design Group has an ROCE of 13%. On its own, that's a standard return, however it's much better than the 9.0% generated by the Consumer Services industry.
Check out our latest analysis for Steve Leung Design Group
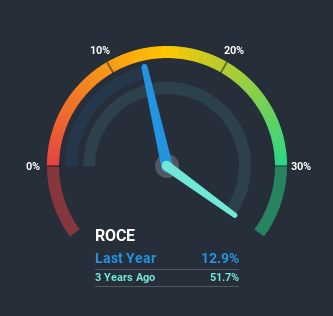
Historical performance is a great place to start when researching a stock so above you can see the gauge for Steve Leung Design Group's ROCE against it's prior returns. If you're interested in investigating Steve Leung Design Group's past further, check out this free graph of past earnings, revenue and cash flow.
How Are Returns Trending?
When we looked at the ROCE trend at Steve Leung Design Group, we didn't gain much confidence. To be more specific, ROCE has fallen from 45% over the last four years. On the other hand, the company has been employing more capital without a corresponding improvement in sales in the last year, which could suggest these investments are longer term plays. It may take some time before the company starts to see any change in earnings from these investments.
On a related note, Steve Leung Design Group has decreased its current liabilities to 27% of total assets. That could partly explain why the ROCE has dropped. What's more, this can reduce some aspects of risk to the business because now the company's suppliers or short-term creditors are funding less of its operations. Some would claim this reduces the business' efficiency at generating ROCE since it is now funding more of the operations with its own money.
What We Can Learn From Steve Leung Design Group's ROCE
To conclude, we've found that Steve Leung Design Group is reinvesting in the business, but returns have been falling. And investors appear hesitant that the trends will pick up because the stock has fallen 35% in the last year. In any case, the stock doesn't have these traits of a multi-bagger discussed above, so if that's what you're looking for, we think you'd have more luck elsewhere.
One more thing: We've identified 2 warning signs with Steve Leung Design Group (at least 1 which makes us a bit uncomfortable) , and understanding these would certainly be useful.
For those who like to invest in solid companies, check out this free list of companies with solid balance sheets and high returns on equity.
If you decide to trade Steve Leung Design Group, use the lowest-cost* platform that is rated #1 Overall by Barron’s, Interactive Brokers. Trade stocks, options, futures, forex, bonds and funds on 135 markets, all from a single integrated account. Promoted
New: Manage All Your Stock Portfolios in One Place
We've created the ultimate portfolio companion for stock investors, and it's free.
• Connect an unlimited number of Portfolios and see your total in one currency
• Be alerted to new Warning Signs or Risks via email or mobile
• Track the Fair Value of your stocks
This article by Simply Wall St is general in nature. It does not constitute a recommendation to buy or sell any stock, and does not take account of your objectives, or your financial situation. We aim to bring you long-term focused analysis driven by fundamental data. Note that our analysis may not factor in the latest price-sensitive company announcements or qualitative material. Simply Wall St has no position in any stocks mentioned.
*Interactive Brokers Rated Lowest Cost Broker by StockBrokers.com Annual Online Review 2020
Have feedback on this article? Concerned about the content? Get in touch with us directly. Alternatively, email editorial-team (at) simplywallst.com.
About SEHK:2262
Steve Leung Design Group
Engages in the provision of interior design services in the People’s Republic of China, Hong Kong, and Macau.
Flawless balance sheet and slightly overvalued.
Market Insights

Advertisement
Community Narratives
The company that turned a verb into a global necessity and basically runs the modern internet, digital ads, smartphones, maps, and AI.
Fair Value US$300.00|7.5% undervalued
OS
Community Contributor
Flowers Foods Pays A Fair Price For Health
Fair Value US$16.12|25.4% undervalued
NV
Community Contributor
TMX Group will thrive with 33.3% profit margin and enduring market moat
Fair Value CA$49.90|3.6% overvalued
LI
Community Contributor
The "Molecular Pencil": Why Beam's Technology is Built to Win
Fair Value US$65.01|65.0% undervalued
DA
Community Contributor