
Advertisement
- Hong Kong
- /
- Consumer Services
- /
- SEHK:2262
Steve Leung Design Group Limited's (HKG:2262) Price Is Right But Growth Is Lacking After Shares Rocket 26%
Despite an already strong run, Steve Leung Design Group Limited (HKG:2262) shares have been powering on, with a gain of 26% in the last thirty days. But the gains over the last month weren't enough to make shareholders whole, as the share price is still down 5.6% in the last twelve months.
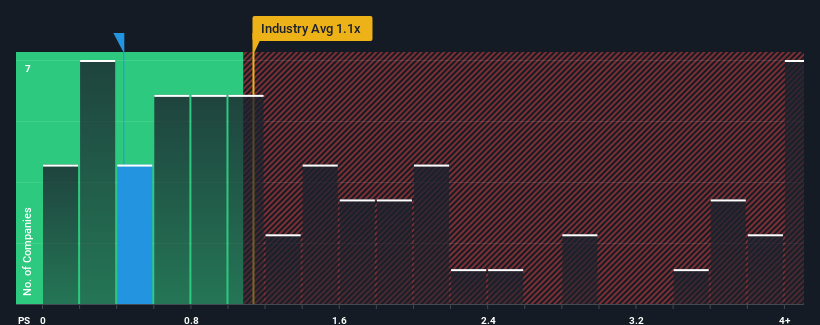
Even after such a large jump in price, it would still be understandable if you think Steve Leung Design Group is a stock with good investment prospects with a price-to-sales ratios (or "P/S") of 0.4x, considering almost half the companies in Hong Kong's Consumer Services industry have P/S ratios above 1.1x. Nonetheless, we'd need to dig a little deeper to determine if there is a rational basis for the reduced P/S.
Check out our latest analysis for Steve Leung Design Group
What Does Steve Leung Design Group's Recent Performance Look Like?
For instance, Steve Leung Design Group's receding revenue in recent times would have to be some food for thought. One possibility is that the P/S is low because investors think the company won't do enough to avoid underperforming the broader industry in the near future. Those who are bullish on Steve Leung Design Group will be hoping that this isn't the case so that they can pick up the stock at a lower valuation.
Although there are no analyst estimates available for Steve Leung Design Group, take a look at this free data-rich visualisation to see how the company stacks up on earnings, revenue and cash flow.What Are Revenue Growth Metrics Telling Us About The Low P/S?
The only time you'd be truly comfortable seeing a P/S as low as Steve Leung Design Group's is when the company's growth is on track to lag the industry.
In reviewing the last year of financials, we were disheartened to see the company's revenues fell to the tune of 6.6%. The last three years don't look nice either as the company has shrunk revenue by 18% in aggregate. Therefore, it's fair to say the revenue growth recently has been undesirable for the company.
In contrast to the company, the rest of the industry is expected to grow by 19% over the next year, which really puts the company's recent medium-term revenue decline into perspective.
With this information, we are not surprised that Steve Leung Design Group is trading at a P/S lower than the industry. Nonetheless, there's no guarantee the P/S has reached a floor yet with revenue going in reverse. There's potential for the P/S to fall to even lower levels if the company doesn't improve its top-line growth.
What Does Steve Leung Design Group's P/S Mean For Investors?
Steve Leung Design Group's stock price has surged recently, but its but its P/S still remains modest. It's argued the price-to-sales ratio is an inferior measure of value within certain industries, but it can be a powerful business sentiment indicator.
As we suspected, our examination of Steve Leung Design Group revealed its shrinking revenue over the medium-term is contributing to its low P/S, given the industry is set to grow. At this stage investors feel the potential for an improvement in revenue isn't great enough to justify a higher P/S ratio. Unless the recent medium-term conditions improve, they will continue to form a barrier for the share price around these levels.
We don't want to rain on the parade too much, but we did also find 3 warning signs for Steve Leung Design Group (1 shouldn't be ignored!) that you need to be mindful of.
If strong companies turning a profit tickle your fancy, then you'll want to check out this free list of interesting companies that trade on a low P/E (but have proven they can grow earnings).
New: Manage All Your Stock Portfolios in One Place
We've created the ultimate portfolio companion for stock investors, and it's free.
• Connect an unlimited number of Portfolios and see your total in one currency
• Be alerted to new Warning Signs or Risks via email or mobile
• Track the Fair Value of your stocks
Have feedback on this article? Concerned about the content? Get in touch with us directly. Alternatively, email editorial-team (at) simplywallst.com.
This article by Simply Wall St is general in nature. We provide commentary based on historical data and analyst forecasts only using an unbiased methodology and our articles are not intended to be financial advice. It does not constitute a recommendation to buy or sell any stock, and does not take account of your objectives, or your financial situation. We aim to bring you long-term focused analysis driven by fundamental data. Note that our analysis may not factor in the latest price-sensitive company announcements or qualitative material. Simply Wall St has no position in any stocks mentioned.
About SEHK:2262
Steve Leung Design Group
Engages in the provision of interior design services in the People’s Republic of China, Hong Kong, and Macau.
Flawless balance sheet and slightly overvalued.
Market Insights

Advertisement
Community Narratives
MicroVision will explode future revenue by 380.37% with a vision towards success
Fair Value US$60.00|98.4% undervalued
TH
Community Contributor
The Indispensable Artery for a New North American Economy
Fair Value CA$132.87|1.3% undervalued
TI
Community Contributor