
Advertisement
What trends should we look for it we want to identify stocks that can multiply in value over the long term? In a perfect world, we'd like to see a company investing more capital into its business and ideally the returns earned from that capital are also increasing. This shows us that it's a compounding machine, able to continually reinvest its earnings back into the business and generate higher returns. Having said that, from a first glance at EC Healthcare (HKG:2138) we aren't jumping out of our chairs at how returns are trending, but let's have a deeper look.
Understanding Return On Capital Employed (ROCE)
For those who don't know, ROCE is a measure of a company's yearly pre-tax profit (its return), relative to the capital employed in the business. To calculate this metric for EC Healthcare, this is the formula:
Return on Capital Employed = Earnings Before Interest and Tax (EBIT) ÷ (Total Assets - Current Liabilities)
0.05 = HK$196m ÷ (HK$5.2b - HK$1.3b) (Based on the trailing twelve months to September 2022).
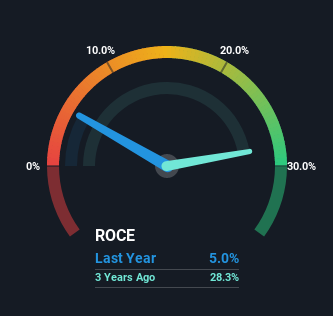
Thus, EC Healthcare has an ROCE of 5.0%. In absolute terms, that's a low return and it also under-performs the Consumer Services industry average of 8.3%.
View our latest analysis for EC Healthcare
Above you can see how the current ROCE for EC Healthcare compares to its prior returns on capital, but there's only so much you can tell from the past. If you'd like to see what analysts are forecasting going forward, you should check out our free report for EC Healthcare.
SWOT Analysis for EC Healthcare
Strength
- Debt is not viewed as a risk.
Weakness
- Earnings declined over the past year.
- Dividend is low compared to the top 25% of dividend payers in the Consumer Services market.
Opportunity
- Annual earnings are forecast to grow faster than the Hong Kong market.
- Trading below our estimate of fair value by more than 20%.
Threat
- Dividends are not covered by earnings.
The Trend Of ROCE
On the surface, the trend of ROCE at EC Healthcare doesn't inspire confidence. Around five years ago the returns on capital were 36%, but since then they've fallen to 5.0%. However, given capital employed and revenue have both increased it appears that the business is currently pursuing growth, at the consequence of short term returns. And if the increased capital generates additional returns, the business, and thus shareholders, will benefit in the long run.
On a related note, EC Healthcare has decreased its current liabilities to 25% of total assets. So we could link some of this to the decrease in ROCE. Effectively this means their suppliers or short-term creditors are funding less of the business, which reduces some elements of risk. Since the business is basically funding more of its operations with it's own money, you could argue this has made the business less efficient at generating ROCE.
The Bottom Line
While returns have fallen for EC Healthcare in recent times, we're encouraged to see that sales are growing and that the business is reinvesting in its operations. These trends don't appear to have influenced returns though, because the total return from the stock has been mostly flat over the last five years. As a result, we'd recommend researching this stock further to uncover what other fundamentals of the business can show us.
One more thing, we've spotted 1 warning sign facing EC Healthcare that you might find interesting.
While EC Healthcare may not currently earn the highest returns, we've compiled a list of companies that currently earn more than 25% return on equity. Check out this free list here.
Valuation is complex, but we're here to simplify it.
Discover if EC Healthcare might be undervalued or overvalued with our detailed analysis, featuring fair value estimates, potential risks, dividends, insider trades, and its financial condition.
Access Free AnalysisHave feedback on this article? Concerned about the content? Get in touch with us directly. Alternatively, email editorial-team (at) simplywallst.com.
This article by Simply Wall St is general in nature. We provide commentary based on historical data and analyst forecasts only using an unbiased methodology and our articles are not intended to be financial advice. It does not constitute a recommendation to buy or sell any stock, and does not take account of your objectives, or your financial situation. We aim to bring you long-term focused analysis driven by fundamental data. Note that our analysis may not factor in the latest price-sensitive company announcements or qualitative material. Simply Wall St has no position in any stocks mentioned.
About SEHK:2138
EC Healthcare
Provides medical and healthcare services in Hong Kong, Macau, Mainland China, and Taiwan.
Good value with mediocre balance sheet.
Market Insights

Advertisement
Community Narratives
MicroVision will explode future revenue by 380.37% with a vision towards success
Fair Value US$60.00|98.4% undervalued
TH
Community Contributor
The Indispensable Artery for a New North American Economy
Fair Value CA$132.87|1.3% undervalued
TI
Community Contributor