
Advertisement
- Hong Kong
- /
- Hospitality
- /
- SEHK:184
Is This A Sign of Things To Come At Keck Seng Investments (Hong Kong) (HKG:184)?
When we're researching a company, it's sometimes hard to find the warning signs, but there are some financial metrics that can help spot trouble early. When we see a declining return on capital employed (ROCE) in conjunction with a declining base of capital employed, that's often how a mature business shows signs of aging. Trends like this ultimately mean the business is reducing its investments and also earning less on what it has invested. So after we looked into Keck Seng Investments (Hong Kong) (HKG:184), the trends above didn't look too great.
What is Return On Capital Employed (ROCE)?
For those who don't know, ROCE is a measure of a company's yearly pre-tax profit (its return), relative to the capital employed in the business. To calculate this metric for Keck Seng Investments (Hong Kong), this is the formula:
Return on Capital Employed = Earnings Before Interest and Tax (EBIT) ÷ (Total Assets - Current Liabilities)
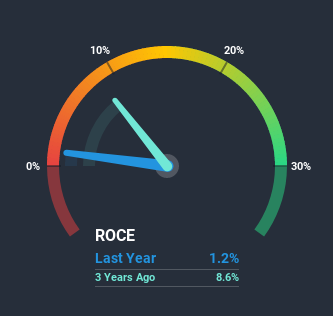
0.012 = HK$55m ÷ (HK$6.4b - HK$2.1b) (Based on the trailing twelve months to June 2020).
Thus, Keck Seng Investments (Hong Kong) has an ROCE of 1.2%. In absolute terms, that's a low return and it also under-performs the Hospitality industry average of 3.3%.
Check out our latest analysis for Keck Seng Investments (Hong Kong)
While the past is not representative of the future, it can be helpful to know how a company has performed historically, which is why we have this chart above. If you're interested in investigating Keck Seng Investments (Hong Kong)'s past further, check out this free graph of past earnings, revenue and cash flow.
What Does the ROCE Trend For Keck Seng Investments (Hong Kong) Tell Us?
We are a bit anxious about the trends of ROCE at Keck Seng Investments (Hong Kong). The company used to generate 6.1% on its capital five years ago but it has since fallen noticeably. In addition to that, Keck Seng Investments (Hong Kong) is now employing 27% less capital than it was five years ago. The fact that both are shrinking is an indication that the business is going through some tough times. If these underlying trends continue, we wouldn't be too optimistic going forward.
While on the subject, we noticed that the ratio of current liabilities to total assets has risen to 32%, which has impacted the ROCE. If current liabilities hadn't increased as much as they did, the ROCE could actually be even lower. Keep an eye on this ratio, because the business could encounter some new risks if this metric gets too high.
The Bottom Line
In short, lower returns and decreasing amounts capital employed in the business doesn't fill us with confidence. It should come as no surprise then that the stock has fallen 39% over the last five years, so it looks like investors are recognizing these changes. With underlying trends that aren't great in these areas, we'd consider looking elsewhere.
If you want to continue researching Keck Seng Investments (Hong Kong), you might be interested to know about the 2 warning signs that our analysis has discovered.
While Keck Seng Investments (Hong Kong) isn't earning the highest return, check out this free list of companies that are earning high returns on equity with solid balance sheets.
When trading Keck Seng Investments (Hong Kong) or any other investment, use the platform considered by many to be the Professional's Gateway to the Worlds Market, Interactive Brokers. You get the lowest-cost* trading on stocks, options, futures, forex, bonds and funds worldwide from a single integrated account. Promoted
Valuation is complex, but we're here to simplify it.
Discover if Keck Seng Investments (Hong Kong) might be undervalued or overvalued with our detailed analysis, featuring fair value estimates, potential risks, dividends, insider trades, and its financial condition.
Access Free AnalysisThis article by Simply Wall St is general in nature. It does not constitute a recommendation to buy or sell any stock, and does not take account of your objectives, or your financial situation. We aim to bring you long-term focused analysis driven by fundamental data. Note that our analysis may not factor in the latest price-sensitive company announcements or qualitative material. Simply Wall St has no position in any stocks mentioned.
*Interactive Brokers Rated Lowest Cost Broker by StockBrokers.com Annual Online Review 2020
Have feedback on this article? Concerned about the content? Get in touch with us directly. Alternatively, email editorial-team (at) simplywallst.com.
About SEHK:184
Keck Seng Investments (Hong Kong)
An investment holding company, engages in hotel and club operations, and property investment and development activities in Macau, Vietnam, the People's Republic of China, Japan, Canada, the United States, and Hong Kong.
Flawless balance sheet and good value.
Similar Companies
Market Insights

Advertisement
Community Narratives
The company that turned a verb into a global necessity and basically runs the modern internet, digital ads, smartphones, maps, and AI.
Fair Value US$300.00|5.4% undervalued
OS
Community Contributor
Flowers Foods Pays A Fair Price For Health
Fair Value US$16.12|26.3% undervalued
NV
Community Contributor
TMX Group will thrive with 33.3% profit margin and enduring market moat
Fair Value CA$49.90|4.1% overvalued
LI
Community Contributor
The "Molecular Pencil": Why Beam's Technology is Built to Win
Fair Value US$65.01|62.7% undervalued
DA
Community Contributor