
Advertisement
- Hong Kong
- /
- Hospitality
- /
- SEHK:1701
Returns On Capital Are Showing Encouraging Signs At Tu Yi Holding (HKG:1701)
Finding a business that has the potential to grow substantially is not easy, but it is possible if we look at a few key financial metrics. One common approach is to try and find a company with returns on capital employed (ROCE) that are increasing, in conjunction with a growing amount of capital employed. Put simply, these types of businesses are compounding machines, meaning they are continually reinvesting their earnings at ever-higher rates of return. So when we looked at Tu Yi Holding (HKG:1701) and its trend of ROCE, we really liked what we saw.
Understanding Return On Capital Employed (ROCE)
For those who don't know, ROCE is a measure of a company's yearly pre-tax profit (its return), relative to the capital employed in the business. Analysts use this formula to calculate it for Tu Yi Holding:
Return on Capital Employed = Earnings Before Interest and Tax (EBIT) ÷ (Total Assets - Current Liabilities)
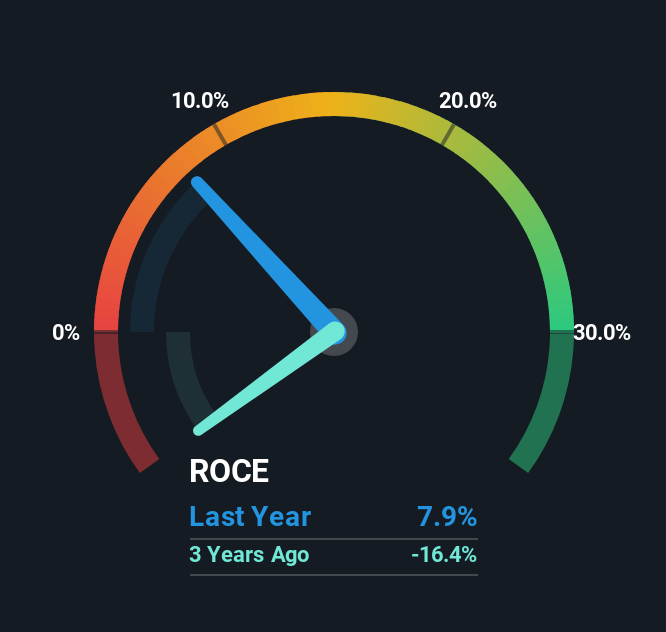
0.079 = CN¥16m ÷ (CN¥264m - CN¥60m) (Based on the trailing twelve months to June 2025).
Thus, Tu Yi Holding has an ROCE of 7.9%. Even though it's in line with the industry average of 8.3%, it's still a low return by itself.
Check out our latest analysis for Tu Yi Holding
While the past is not representative of the future, it can be helpful to know how a company has performed historically, which is why we have this chart above. If you're interested in investigating Tu Yi Holding's past further, check out this free graph covering Tu Yi Holding's past earnings, revenue and cash flow.
What The Trend Of ROCE Can Tell Us
Tu Yi Holding has not disappointed in regards to ROCE growth. The data shows that returns on capital have increased by 4,658% over the trailing five years. The company is now earning CN¥0.08 per dollar of capital employed. Speaking of capital employed, the company is actually utilizing 33% less than it was five years ago, which can be indicative of a business that's improving its efficiency. If this trend continues, the business might be getting more efficient but it's shrinking in terms of total assets.
On a side note, we noticed that the improvement in ROCE appears to be partly fueled by an increase in current liabilities. The current liabilities has increased to 23% of total assets, so the business is now more funded by the likes of its suppliers or short-term creditors. It's worth keeping an eye on this because as the percentage of current liabilities to total assets increases, some aspects of risk also increase.
What We Can Learn From Tu Yi Holding's ROCE
In summary, it's great to see that Tu Yi Holding has been able to turn things around and earn higher returns on lower amounts of capital. And since the stock has fallen 56% over the last five years, there might be an opportunity here. With that in mind, we believe the promising trends warrant this stock for further investigation.
On a final note, we've found 3 warning signs for Tu Yi Holding that we think you should be aware of.
If you want to search for solid companies with great earnings, check out this free list of companies with good balance sheets and impressive returns on equity.
Valuation is complex, but we're here to simplify it.
Discover if Tu Yi Holding might be undervalued or overvalued with our detailed analysis, featuring fair value estimates, potential risks, dividends, insider trades, and its financial condition.
Access Free AnalysisHave feedback on this article? Concerned about the content? Get in touch with us directly. Alternatively, email editorial-team (at) simplywallst.com.
This article by Simply Wall St is general in nature. We provide commentary based on historical data and analyst forecasts only using an unbiased methodology and our articles are not intended to be financial advice. It does not constitute a recommendation to buy or sell any stock, and does not take account of your objectives, or your financial situation. We aim to bring you long-term focused analysis driven by fundamental data. Note that our analysis may not factor in the latest price-sensitive company announcements or qualitative material. Simply Wall St has no position in any stocks mentioned.
About SEHK:1701
Tu Yi Holding
An investment holding company, provides outbound travel products and service in the People’s Republic of China and Japan.
Excellent balance sheet with proven track record.
Market Insights

Advertisement
Community Narratives
MicroVision will explode future revenue by 380.37% with a vision towards success
Fair Value US$60.00|98.5% undervalued
TH
Community Contributor
The Indispensable Artery for a New North American Economy
Fair Value CA$132.87|2.3% undervalued
TI
Community Contributor