- Hong Kong
- /
- Hospitality
- /
- SEHK:1314
If You Had Bought Tsui Wah Holdings' (HKG:1314) Shares Five Years Ago You Would Be Down 78%
Tsui Wah Holdings Limited (HKG:1314) shareholders should be happy to see the share price up 22% in the last quarter. But will that repair the damage for the weary investors who have owned this stock as it declined over half a decade? Probably not. Five years have seen the share price descend precipitously, down a full 78%. While the recent increase might be a green shoot, we're certainly hesitant to rejoice. The fundamental business performance will ultimately determine if the turnaround can be sustained.
View our latest analysis for Tsui Wah Holdings
Tsui Wah Holdings isn't currently profitable, so most analysts would look to revenue growth to get an idea of how fast the underlying business is growing. Generally speaking, companies without profits are expected to grow revenue every year, and at a good clip. As you can imagine, fast revenue growth, when maintained, often leads to fast profit growth.
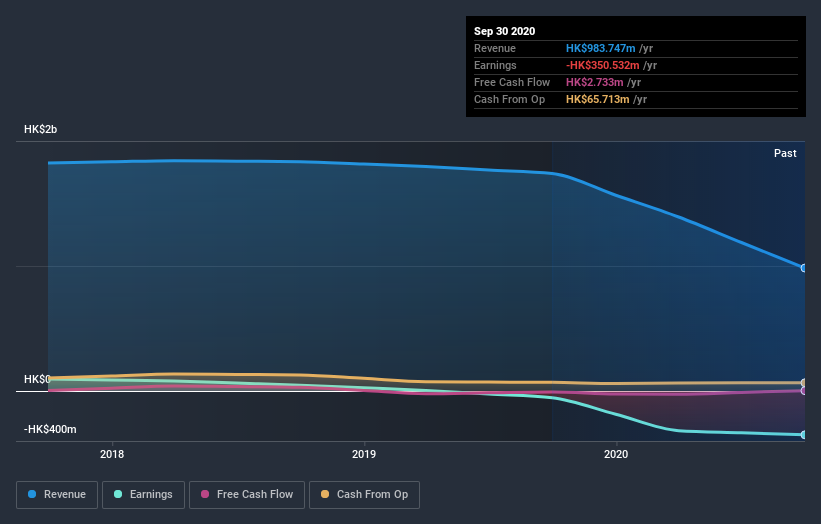
Over half a decade Tsui Wah Holdings reduced its trailing twelve month revenue by 6.6% for each year. While far from catastrophic that is not good. The share price fall of 12% (per year, over five years) is a stern reminder that money-losing companies are expected to grow revenue. It takes a certain kind of mental fortitude (or recklessness) to buy shares in a company that loses money and doesn't grow revenue. Fear of becoming a 'bagholder' may be keeping people away from this stock.
You can see how earnings and revenue have changed over time in the image below (click on the chart to see the exact values).

This free interactive report on Tsui Wah Holdings' balance sheet strength is a great place to start, if you want to investigate the stock further.
What about the Total Shareholder Return (TSR)?
We'd be remiss not to mention the difference between Tsui Wah Holdings' total shareholder return (TSR) and its share price return. Arguably the TSR is a more complete return calculation because it accounts for the value of dividends (as if they were reinvested), along with the hypothetical value of any discounted capital that have been offered to shareholders. Dividends have been really beneficial for Tsui Wah Holdings shareholders, and that cash payout explains why its total shareholder loss of 74%, over the last 5 years, isn't as bad as the share price return.
A Different Perspective
Tsui Wah Holdings shareholders are down 8.3% for the year, but the market itself is up 36%. However, keep in mind that even the best stocks will sometimes underperform the market over a twelve month period. Unfortunately, longer term shareholders are suffering worse, given the loss of 12% doled out over the last five years. We'd need to see some sustained improvements in the key metrics before we could muster much enthusiasm. While it is well worth considering the different impacts that market conditions can have on the share price, there are other factors that are even more important. Consider for instance, the ever-present spectre of investment risk. We've identified 2 warning signs with Tsui Wah Holdings (at least 1 which can't be ignored) , and understanding them should be part of your investment process.
Of course, you might find a fantastic investment by looking elsewhere. So take a peek at this free list of companies we expect will grow earnings.
Please note, the market returns quoted in this article reflect the market weighted average returns of stocks that currently trade on HK exchanges.
When trading Tsui Wah Holdings or any other investment, use the platform considered by many to be the Professional's Gateway to the Worlds Market, Interactive Brokers. You get the lowest-cost* trading on stocks, options, futures, forex, bonds and funds worldwide from a single integrated account. Promoted
Valuation is complex, but we're here to simplify it.
Discover if Tsui Wah Holdings might be undervalued or overvalued with our detailed analysis, featuring fair value estimates, potential risks, dividends, insider trades, and its financial condition.
Access Free AnalysisThis article by Simply Wall St is general in nature. It does not constitute a recommendation to buy or sell any stock, and does not take account of your objectives, or your financial situation. We aim to bring you long-term focused analysis driven by fundamental data. Note that our analysis may not factor in the latest price-sensitive company announcements or qualitative material. Simply Wall St has no position in any stocks mentioned.
*Interactive Brokers Rated Lowest Cost Broker by StockBrokers.com Annual Online Review 2020
Have feedback on this article? Concerned about the content? Get in touch with us directly. Alternatively, email editorial-team (at) simplywallst.com.
About SEHK:1314
Tsui Wah Holdings
An investment holding company, engages in the operation of restaurants and sale of food in Hong Kong, Mainland China, and internationally.
Flawless balance sheet and fair value.
Market Insights
Community Narratives


