
Advertisement
- Hong Kong
- /
- Food and Staples Retail
- /
- SEHK:8057
Risks Still Elevated At These Prices As Madison Holdings Group Limited (HKG:8057) Shares Dive 30%
Unfortunately for some shareholders, the Madison Holdings Group Limited (HKG:8057) share price has dived 30% in the last thirty days, prolonging recent pain. The recent drop completes a disastrous twelve months for shareholders, who are sitting on a 76% loss during that time.
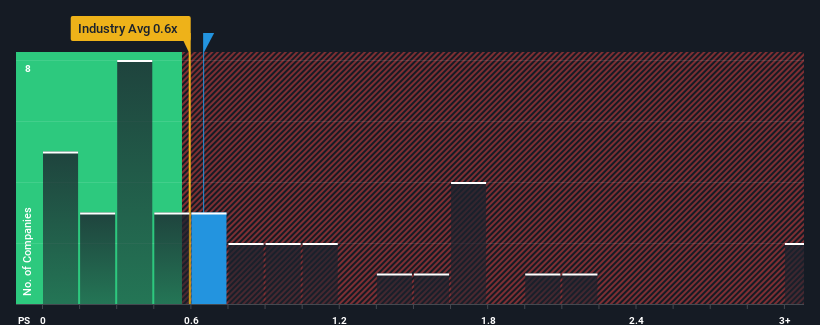
Even after such a large drop in price, it's still not a stretch to say that Madison Holdings Group's price-to-sales (or "P/S") ratio of 0.6x right now seems quite "middle-of-the-road" compared to the Consumer Retailing industry in Hong Kong, seeing as it matches the P/S ratio of the wider industry. However, investors might be overlooking a clear opportunity or potential setback if there is no rational basis for the P/S.
View our latest analysis for Madison Holdings Group
How Madison Holdings Group Has Been Performing
For example, consider that Madison Holdings Group's financial performance has been poor lately as its revenue has been in decline. Perhaps investors believe the recent revenue performance is enough to keep in line with the industry, which is keeping the P/S from dropping off. If you like the company, you'd at least be hoping this is the case so that you could potentially pick up some stock while it's not quite in favour.
Want the full picture on earnings, revenue and cash flow for the company? Then our free report on Madison Holdings Group will help you shine a light on its historical performance.Do Revenue Forecasts Match The P/S Ratio?
The only time you'd be comfortable seeing a P/S like Madison Holdings Group's is when the company's growth is tracking the industry closely.
Retrospectively, the last year delivered a frustrating 29% decrease to the company's top line. The last three years don't look nice either as the company has shrunk revenue by 31% in aggregate. So unfortunately, we have to acknowledge that the company has not done a great job of growing revenue over that time.
Comparing that to the industry, which is predicted to deliver 11% growth in the next 12 months, the company's downward momentum based on recent medium-term revenue results is a sobering picture.
With this information, we find it concerning that Madison Holdings Group is trading at a fairly similar P/S compared to the industry. It seems most investors are ignoring the recent poor growth rate and are hoping for a turnaround in the company's business prospects. Only the boldest would assume these prices are sustainable as a continuation of recent revenue trends is likely to weigh on the share price eventually.
The Bottom Line On Madison Holdings Group's P/S
Following Madison Holdings Group's share price tumble, its P/S is just clinging on to the industry median P/S. While the price-to-sales ratio shouldn't be the defining factor in whether you buy a stock or not, it's quite a capable barometer of revenue expectations.
We find it unexpected that Madison Holdings Group trades at a P/S ratio that is comparable to the rest of the industry, despite experiencing declining revenues during the medium-term, while the industry as a whole is expected to grow. When we see revenue heading backwards in the context of growing industry forecasts, it'd make sense to expect a possible share price decline on the horizon, sending the moderate P/S lower. If recent medium-term revenue trends continue, it will place shareholders' investments at risk and potential investors in danger of paying an unnecessary premium.
It is also worth noting that we have found 2 warning signs for Madison Holdings Group that you need to take into consideration.
If strong companies turning a profit tickle your fancy, then you'll want to check out this free list of interesting companies that trade on a low P/E (but have proven they can grow earnings).
New: Manage All Your Stock Portfolios in One Place
We've created the ultimate portfolio companion for stock investors, and it's free.
• Connect an unlimited number of Portfolios and see your total in one currency
• Be alerted to new Warning Signs or Risks via email or mobile
• Track the Fair Value of your stocks
Have feedback on this article? Concerned about the content? Get in touch with us directly. Alternatively, email editorial-team (at) simplywallst.com.
This article by Simply Wall St is general in nature. We provide commentary based on historical data and analyst forecasts only using an unbiased methodology and our articles are not intended to be financial advice. It does not constitute a recommendation to buy or sell any stock, and does not take account of your objectives, or your financial situation. We aim to bring you long-term focused analysis driven by fundamental data. Note that our analysis may not factor in the latest price-sensitive company announcements or qualitative material. Simply Wall St has no position in any stocks mentioned.
About SEHK:8057
Madison Holdings Group
An investment holding company, retails and wholesales wine products and other alcoholic beverages in the People’s Republic of China and Hong Kong.
Excellent balance sheet with very low risk.
Market Insights

Advertisement
Community Narratives
MicroVision will explode future revenue by 380.37% with a vision towards success
Fair Value US$60.00|98.3% undervalued
TH
Community Contributor
The Indispensable Artery for a New North American Economy
Fair Value CA$132.87|1.0% undervalued
TI
Community Contributor