Advertisement
- Hong Kong
- /
- Food and Staples Retail
- /
- SEHK:6808
Assessing Sun Art Retail Group (SEHK:6808) Valuation After Weaker Earnings and Dividend Cut

Simply Wall St
Reviewed by Simply Wall St
Sun Art Retail Group (SEHK:6808) just released its half-year results, revealing a drop in sales and a shift from a profit last year to a net loss. In addition, the company reduced its interim dividend per share.
See our latest analysis for Sun Art Retail Group.
Following the weaker half-year results and trimmed dividend, Sun Art Retail Group’s 1-year share price return is down 8.6% year-to-date, with total shareholder return over the same period falling 4.5%. Momentum appears to be fading, as longer-term investors have seen an 18.9% total return over three years erased by a steep 72% five-year decline. This suggests sentiment remains cautious despite some past resilience.
If recent retail sector headwinds have you rethinking your strategy, now’s the perfect opportunity to broaden your search and discover fast growing stocks with high insider ownership
With sales slipping, earnings swinging to a loss, and the share price still below analyst targets, investors may wonder: is Sun Art Retail Group attractively undervalued today, or is the market already factoring in future growth prospects?
Price-to-Sales of 0.2x: Is it justified?
Sun Art Retail Group is trading at a price-to-sales ratio of just 0.2x, which puts its shares well below both the industry and peer averages, with the last close at HK$1.81.
The price-to-sales ratio compares the company’s market value to its annual sales, showing how much investors are willing to pay for each dollar of revenue. For retail businesses with tight margins, this multiple can be a crucial indicator of perceived value or discount.
Such a low ratio suggests the market is heavily discounting the company’s revenue potential, possibly reflecting uncertainty around future growth or profits. However, the fact that the company is trading at a fraction of both the industry average (0.6x) and the peer group (1.8x) points to significant pessimism. This could change if performance stabilizes or improves. Based on regression analysis, the estimated fair price-to-sales ratio for Sun Art Retail Group is also 0.6x, supporting the view that the valuation is unusually discounted right now.
Explore the SWS fair ratio for Sun Art Retail Group
Result: Price-to-Sales of 0.2x (UNDERVALUED)
However, continued weak sales or unexpected losses could further erode market confidence and pose a risk to any hopes for a valuation rebound.
Find out about the key risks to this Sun Art Retail Group narrative.
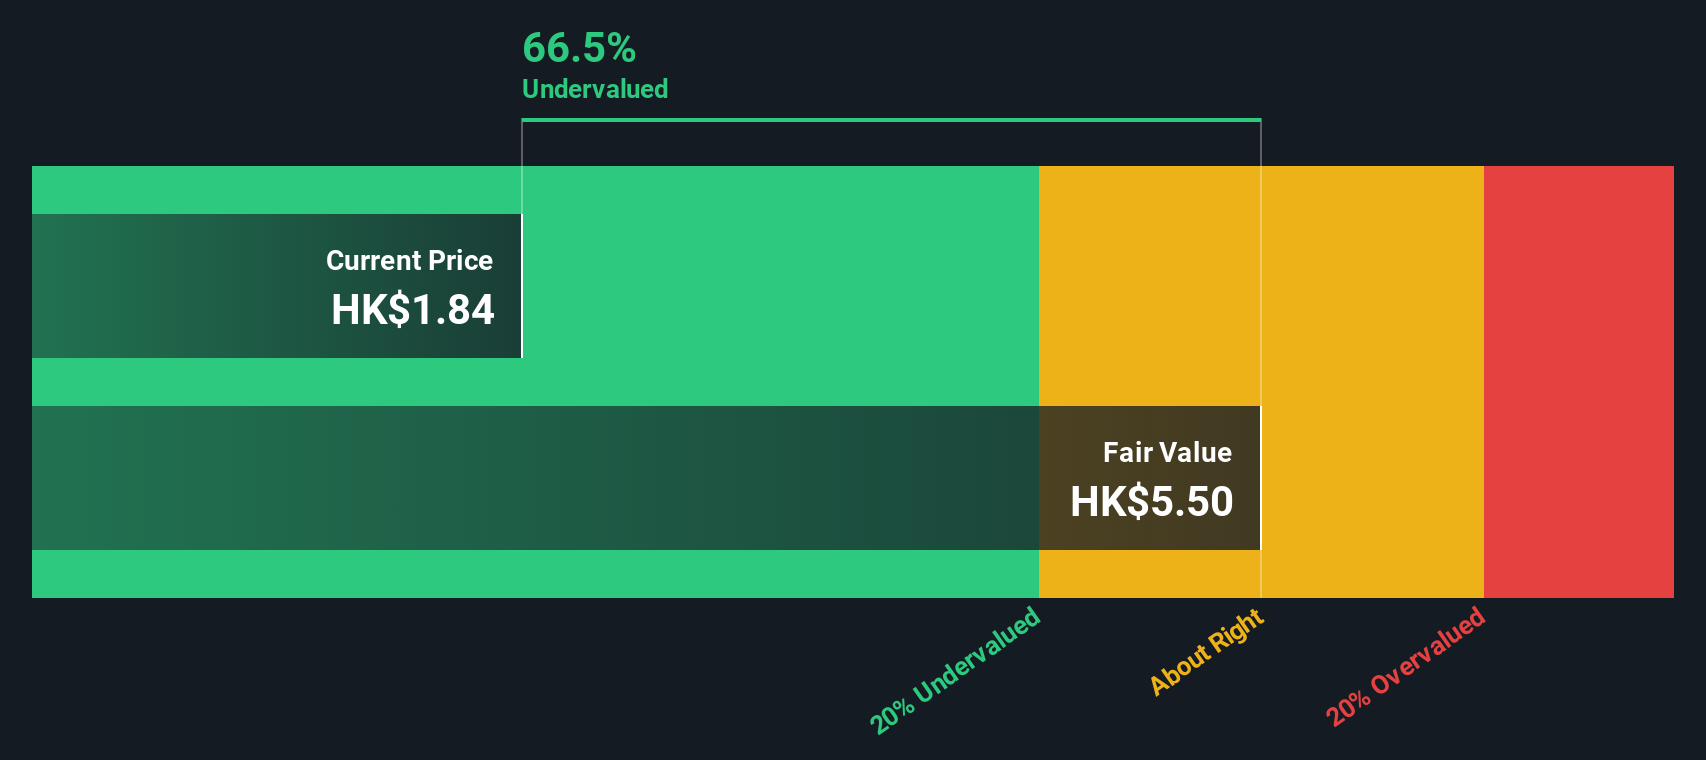
Another View: SWS DCF Model Perspective
While the low price-to-sales ratio suggests an undervalued stock from a market multiples angle, our DCF model presents a similar perspective. It estimates Sun Art Retail Group’s fair value at HK$5.05 per share, compared to its current price of HK$1.81, which indicates significant undervaluation.
Look into how the SWS DCF model arrives at its fair value.
Simply Wall St performs a discounted cash flow (DCF) on every stock in the world every day (check out Sun Art Retail Group for example). We show the entire calculation in full. You can track the result in your watchlist or portfolio and be alerted when this changes, or use our stock screener to discover 918 undervalued stocks based on their cash flows. If you save a screener we even alert you when new companies match - so you never miss a potential opportunity.
Build Your Own Sun Art Retail Group Narrative
If our analysis does not align with your perspective, or you would like to review the figures independently, you can quickly create your own assessment in just a few minutes, starting here: Do it your way
A great starting point for your Sun Art Retail Group research is our analysis highlighting 5 key rewards and 2 important warning signs that could impact your investment decision.
Looking for more investment ideas?
Unlock a world of opportunities by taking charge of your investment journey. Don’t let the market pass you by while others uncover the next big winners.
- Capture reliable income streams by reviewing these 16 dividend stocks with yields > 3% offering yields above 3% and strengthen your portfolio with dependable payouts.
- Pinpoint true bargains waiting to be found by assessing these 918 undervalued stocks based on cash flows based on cash flow potential and set your sights on smart value buying.
- Accelerate your strategy with game-changing innovation by checking out these 26 AI penny stocks that are leading advancements in artificial intelligence.
This article by Simply Wall St is general in nature. We provide commentary based on historical data and analyst forecasts only using an unbiased methodology and our articles are not intended to be financial advice. It does not constitute a recommendation to buy or sell any stock, and does not take account of your objectives, or your financial situation. We aim to bring you long-term focused analysis driven by fundamental data. Note that our analysis may not factor in the latest price-sensitive company announcements or qualitative material. Simply Wall St has no position in any stocks mentioned.
New: Manage All Your Stock Portfolios in One Place
We've created the ultimate portfolio companion for stock investors, and it's free.
• Connect an unlimited number of Portfolios and see your total in one currency
• Be alerted to new Warning Signs or Risks via email or mobile
• Track the Fair Value of your stocks
Have feedback on this article? Concerned about the content? Get in touch with us directly. Alternatively, email editorial-team@simplywallst.com
About SEHK:6808
Sun Art Retail Group
An investment holding company, operates brick-and-mortar stores and online sales channels in the People’s Republic of China.
Very undervalued with adequate balance sheet and pays a dividend.
Similar Companies
Market Insights

Advertisement
Community Narratives
MicroVision will explode future revenue by 380.37% with a vision towards success
Fair Value US$60.00|98.5% undervalued
TH
Community Contributor
The Indispensable Artery for a New North American Economy
Fair Value CA$132.87|2.3% undervalued
TI
Community Contributor