
Advertisement
- Hong Kong
- /
- Food and Staples Retail
- /
- SEHK:314
Sipai Health Technology Co., Ltd.'s (HKG:314) 32% Cheaper Price Remains In Tune With Revenues
Sipai Health Technology Co., Ltd. (HKG:314) shares have had a horrible month, losing 32% after a relatively good period beforehand. The drop over the last 30 days has capped off a tough year for shareholders, with the share price down 31% in that time.
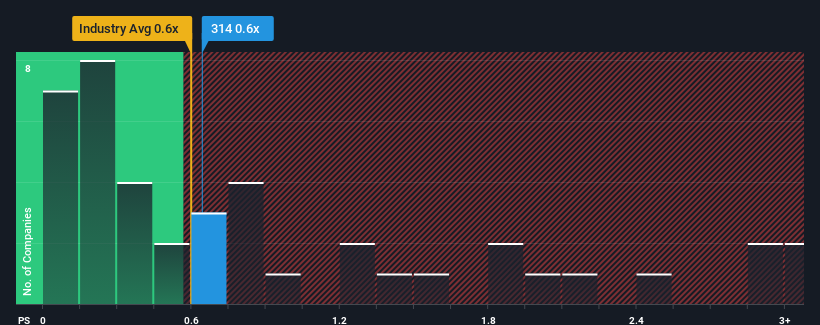
In spite of the heavy fall in price, you could still be forgiven for feeling indifferent about Sipai Health Technology's P/S ratio of 0.6x, since the median price-to-sales (or "P/S") ratio for the Consumer Retailing industry in Hong Kong is about the same. Although, it's not wise to simply ignore the P/S without explanation as investors may be disregarding a distinct opportunity or a costly mistake.
We check all companies for important risks. See what we found for Sipai Health Technology in our free report.See our latest analysis for Sipai Health Technology
What Does Sipai Health Technology's Recent Performance Look Like?
As an illustration, revenue has deteriorated at Sipai Health Technology over the last year, which is not ideal at all. It might be that many expect the company to put the disappointing revenue performance behind them over the coming period, which has kept the P/S from falling. If you like the company, you'd at least be hoping this is the case so that you could potentially pick up some stock while it's not quite in favour.
Want the full picture on earnings, revenue and cash flow for the company? Then our free report on Sipai Health Technology will help you shine a light on its historical performance.Do Revenue Forecasts Match The P/S Ratio?
There's an inherent assumption that a company should be matching the industry for P/S ratios like Sipai Health Technology's to be considered reasonable.
Retrospectively, the last year delivered a frustrating 3.1% decrease to the company's top line. However, a few very strong years before that means that it was still able to grow revenue by an impressive 31% in total over the last three years. So we can start by confirming that the company has generally done a very good job of growing revenue over that time, even though it had some hiccups along the way.
Comparing that to the industry, which is predicted to deliver 10% growth in the next 12 months, the company's momentum is pretty similar based on recent medium-term annualised revenue results.
With this information, we can see why Sipai Health Technology is trading at a fairly similar P/S to the industry. Apparently shareholders are comfortable to simply hold on assuming the company will continue keeping a low profile.
The Key Takeaway
Following Sipai Health Technology's share price tumble, its P/S is just clinging on to the industry median P/S. While the price-to-sales ratio shouldn't be the defining factor in whether you buy a stock or not, it's quite a capable barometer of revenue expectations.
As we've seen, Sipai Health Technology's three-year revenue trends seem to be contributing to its P/S, given they look similar to current industry expectations. With previous revenue trends that keep up with the current industry outlook, it's hard to justify the company's P/S ratio deviating much from it's current point. Given the current circumstances, it seems improbable that the share price will experience any significant movement in either direction in the near future if recent medium-term revenue trends persist.
A lot of potential risks can sit within a company's balance sheet. Take a look at our free balance sheet analysis for Sipai Health Technology with six simple checks on some of these key factors.
If these risks are making you reconsider your opinion on Sipai Health Technology, explore our interactive list of high quality stocks to get an idea of what else is out there.
New: Manage All Your Stock Portfolios in One Place
We've created the ultimate portfolio companion for stock investors, and it's free.
• Connect an unlimited number of Portfolios and see your total in one currency
• Be alerted to new Warning Signs or Risks via email or mobile
• Track the Fair Value of your stocks
Have feedback on this article? Concerned about the content? Get in touch with us directly. Alternatively, email editorial-team (at) simplywallst.com.
This article by Simply Wall St is general in nature. We provide commentary based on historical data and analyst forecasts only using an unbiased methodology and our articles are not intended to be financial advice. It does not constitute a recommendation to buy or sell any stock, and does not take account of your objectives, or your financial situation. We aim to bring you long-term focused analysis driven by fundamental data. Note that our analysis may not factor in the latest price-sensitive company announcements or qualitative material. Simply Wall St has no position in any stocks mentioned.
About SEHK:314
Sipai Health Technology
Operates as a medical technology and health management company in the People’s Republic of China.
Excellent balance sheet and fair value.
Market Insights

Advertisement
Community Narratives
MicroVision will explode future revenue by 380.37% with a vision towards success
Fair Value US$60.00|98.3% undervalued
TH
Community Contributor
The Indispensable Artery for a New North American Economy
Fair Value CA$132.87|1.0% undervalued
TI
Community Contributor