Stock Analysis
Further weakness as Viva Goods (HKG:933) drops 7.4% this week, taking one-year losses to 54%


Investing in stocks comes with the risk that the share price will fall. Anyone who held Viva Goods Company Limited (HKG:933) over the last year knows what a loser feels like. The share price has slid 55% in that time. To make matters worse, the returns over three years have also been really disappointing (the share price is 44% lower than three years ago). Even worse, it's down 10.0% in about a month, which isn't fun at all. We do note, however, that the broader market is down 4.2% in that period, and this may have weighed on the share price.
If the past week is anything to go by, investor sentiment for Viva Goods isn't positive, so let's see if there's a mismatch between fundamentals and the share price.
See our latest analysis for Viva Goods
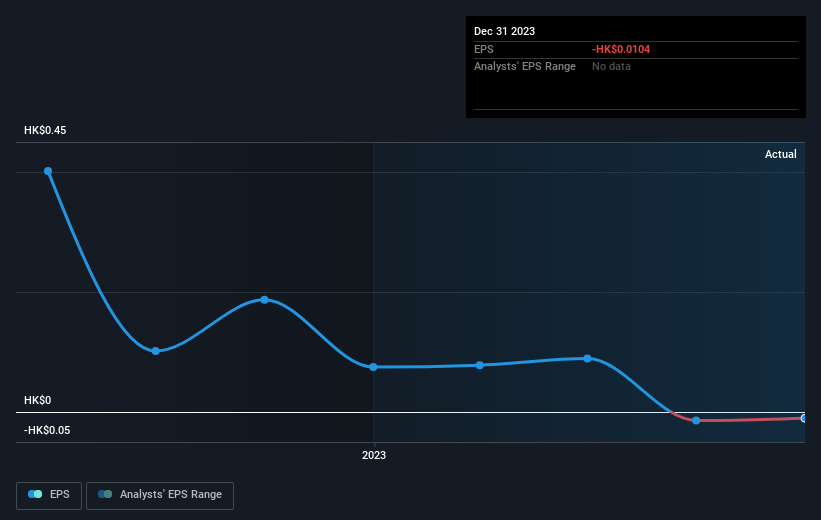
While the efficient markets hypothesis continues to be taught by some, it has been proven that markets are over-reactive dynamic systems, and investors are not always rational. One imperfect but simple way to consider how the market perception of a company has shifted is to compare the change in the earnings per share (EPS) with the share price movement.
Viva Goods fell to a loss making position during the year. Buyers no doubt think it's a temporary situation, but those with a nose for quality have low tolerance for losses. However, there may be an opportunity for investors if the company can recover.
The image below shows how EPS has tracked over time (if you click on the image you can see greater detail).
This free interactive report on Viva Goods' earnings, revenue and cash flow is a great place to start, if you want to investigate the stock further.
A Different Perspective
Viva Goods shareholders are down 54% for the year (even including dividends), but the market itself is up 5.7%. However, keep in mind that even the best stocks will sometimes underperform the market over a twelve month period. On the bright side, long term shareholders have made money, with a gain of 8% per year over half a decade. If the fundamental data continues to indicate long term sustainable growth, the current sell-off could be an opportunity worth considering. You could get a better understanding of Viva Goods' growth by checking out this more detailed historical graph of earnings, revenue and cash flow.
Of course Viva Goods may not be the best stock to buy. So you may wish to see this free collection of growth stocks.
Please note, the market returns quoted in this article reflect the market weighted average returns of stocks that currently trade on Hong Kong exchanges.
New: Manage All Your Stock Portfolios in One Place
We've created the ultimate portfolio companion for stock investors, and it's free.
• Connect an unlimited number of Portfolios and see your total in one currency
• Be alerted to new Warning Signs or Risks via email or mobile
• Track the Fair Value of your stocks
Have feedback on this article? Concerned about the content? Get in touch with us directly. Alternatively, email editorial-team (at) simplywallst.com.
This article by Simply Wall St is general in nature. We provide commentary based on historical data and analyst forecasts only using an unbiased methodology and our articles are not intended to be financial advice. It does not constitute a recommendation to buy or sell any stock, and does not take account of your objectives, or your financial situation. We aim to bring you long-term focused analysis driven by fundamental data. Note that our analysis may not factor in the latest price-sensitive company announcements or qualitative material. Simply Wall St has no position in any stocks mentioned.
Have feedback on this article? Concerned about the content? Get in touch with us directly. Alternatively, email editorial-team@simplywallst.com
About SEHK:933
Viva Goods
An investment holding company, provides apparel and footwear in the United Kingdom, the Republic of Ireland, America, the People’s Republic of China, Asia, Europe, the Middle East, and Africa.
Excellent balance sheet and slightly overvalued.
