
Advertisement
- Hong Kong
- /
- Consumer Durables
- /
- SEHK:751
Despite lower earnings than five years ago, Skyworth Group (HKG:751) investors are up 106% since then
Skyworth Group Limited (HKG:751) shareholders have seen the share price descend 14% over the month. On the bright side the returns have been quite good over the last half decade. After all, the share price is up a market-beating 88% in that time.
While this past week has detracted from the company's five-year return, let's look at the recent trends of the underlying business and see if the gains have been in alignment.
While the efficient markets hypothesis continues to be taught by some, it has been proven that markets are over-reactive dynamic systems, and investors are not always rational. By comparing earnings per share (EPS) and share price changes over time, we can get a feel for how investor attitudes to a company have morphed over time.
Skyworth Group's earnings per share are down 12% per year, despite strong share price performance over five years.
This means it's unlikely the market is judging the company based on earnings growth. Because earnings per share don't seem to match up with the share price, we'll take a look at other metrics instead.
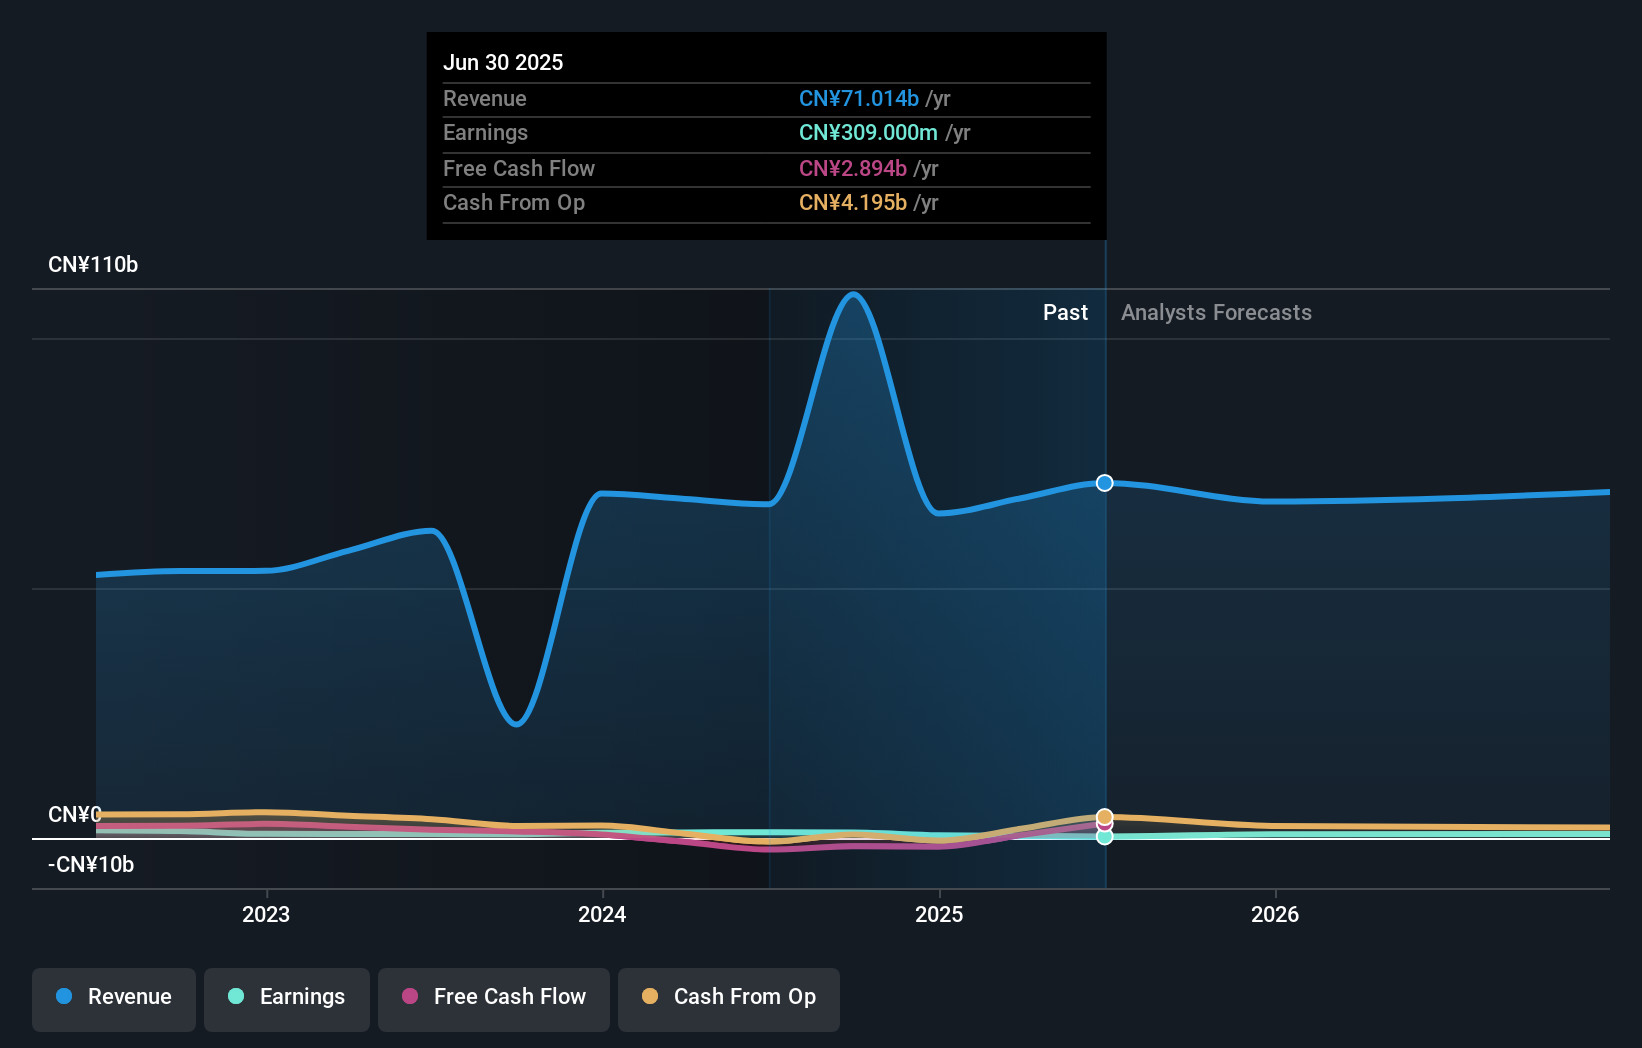
In contrast revenue growth of 14% per year is probably viewed as evidence that Skyworth Group is growing, a real positive. It's quite possible that management are prioritizing revenue growth over EPS growth at the moment.
The company's revenue and earnings (over time) are depicted in the image below (click to see the exact numbers).
You can see how its balance sheet has strengthened (or weakened) over time in this free interactive graphic.
What About The Total Shareholder Return (TSR)?
We've already covered Skyworth Group's share price action, but we should also mention its total shareholder return (TSR). Arguably the TSR is a more complete return calculation because it accounts for the value of dividends (as if they were reinvested), along with the hypothetical value of any discounted capital that have been offered to shareholders. Dividends have been really beneficial for Skyworth Group shareholders, and that cash payout contributed to why its TSR of 106%, over the last 5 years, is better than the share price return.
A Different Perspective
Skyworth Group provided a TSR of 27% over the last twelve months. But that return falls short of the market. The silver lining is that the gain was actually better than the average annual return of 16% per year over five year. This suggests the company might be improving over time. It's always interesting to track share price performance over the longer term. But to understand Skyworth Group better, we need to consider many other factors. Take risks, for example - Skyworth Group has 2 warning signs we think you should be aware of.
But note: Skyworth Group may not be the best stock to buy. So take a peek at this free list of interesting companies with past earnings growth (and further growth forecast).
Please note, the market returns quoted in this article reflect the market weighted average returns of stocks that currently trade on Hong Kong exchanges.
New: Manage All Your Stock Portfolios in One Place
We've created the ultimate portfolio companion for stock investors, and it's free.
• Connect an unlimited number of Portfolios and see your total in one currency
• Be alerted to new Warning Signs or Risks via email or mobile
• Track the Fair Value of your stocks
Have feedback on this article? Concerned about the content? Get in touch with us directly. Alternatively, email editorial-team (at) simplywallst.com.
This article by Simply Wall St is general in nature. We provide commentary based on historical data and analyst forecasts only using an unbiased methodology and our articles are not intended to be financial advice. It does not constitute a recommendation to buy or sell any stock, and does not take account of your objectives, or your financial situation. We aim to bring you long-term focused analysis driven by fundamental data. Note that our analysis may not factor in the latest price-sensitive company announcements or qualitative material. Simply Wall St has no position in any stocks mentioned.
About SEHK:751
Skyworth Group
Researches, develops, manufactures, sells, and trades in consumer electronic products in Mainland China, Asia, Europe, the Americas, and Africa.
Excellent balance sheet and fair value.
Similar Companies
Market Insights

Advertisement
Community Narratives
The company that turned a verb into a global necessity and basically runs the modern internet, digital ads, smartphones, maps, and AI.
Fair Value US$300.00|6.2% undervalued
OS
Community Contributor
Flowers Foods Pays A Fair Price For Health
Fair Value US$16.12|26.0% undervalued
NV
Community Contributor
TMX Group will thrive with 33.3% profit margin and enduring market moat
Fair Value CA$49.90|3.7% overvalued
LI
Community Contributor