The past five years for Yue Yuen Industrial (Holdings) (HKG:551) investors has not been profitable


Yue Yuen Industrial (Holdings) Limited (HKG:551) shareholders should be happy to see the share price up 13% in the last month. But over the last half decade, the stock has not performed well. You would have done a lot better buying an index fund, since the stock has dropped 38% in that half decade.
So let's have a look and see if the longer term performance of the company has been in line with the underlying business' progress.
View our latest analysis for Yue Yuen Industrial (Holdings)
While the efficient markets hypothesis continues to be taught by some, it has been proven that markets are over-reactive dynamic systems, and investors are not always rational. One way to examine how market sentiment has changed over time is to look at the interaction between a company's share price and its earnings per share (EPS).
While the share price declined over five years, Yue Yuen Industrial (Holdings) actually managed to increase EPS by an average of 3.1% per year. Given the share price reaction, one might suspect that EPS is not a good guide to the business performance during the period (perhaps due to a one-off loss or gain). Or possibly, the market was previously very optimistic, so the stock has disappointed, despite improving EPS.
By glancing at these numbers, we'd posit that the the market had expectations of much higher growth, five years ago. Looking to other metrics might better explain the share price change.
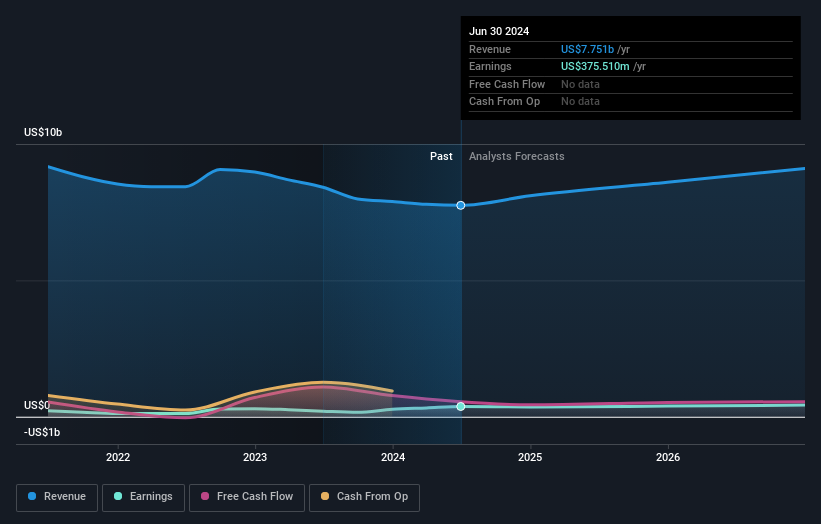
The most recent dividend was actually lower than it was in the past, so that may have sent the share price lower. The revenue decline of about 4.5% per year might also encourage sellers.
The graphic below depicts how earnings and revenue have changed over time (unveil the exact values by clicking on the image).
Yue Yuen Industrial (Holdings) is a well known stock, with plenty of analyst coverage, suggesting some visibility into future growth. If you are thinking of buying or selling Yue Yuen Industrial (Holdings) stock, you should check out this free report showing analyst consensus estimates for future profits.
What About Dividends?
As well as measuring the share price return, investors should also consider the total shareholder return (TSR). Whereas the share price return only reflects the change in the share price, the TSR includes the value of dividends (assuming they were reinvested) and the benefit of any discounted capital raising or spin-off. So for companies that pay a generous dividend, the TSR is often a lot higher than the share price return. As it happens, Yue Yuen Industrial (Holdings)'s TSR for the last 5 years was -19%, which exceeds the share price return mentioned earlier. The dividends paid by the company have thusly boosted the total shareholder return.
A Different Perspective
It's nice to see that Yue Yuen Industrial (Holdings) shareholders have received a total shareholder return of 44% over the last year. That's including the dividend. There's no doubt those recent returns are much better than the TSR loss of 4% per year over five years. We generally put more weight on the long term performance over the short term, but the recent improvement could hint at a (positive) inflection point within the business. I find it very interesting to look at share price over the long term as a proxy for business performance. But to truly gain insight, we need to consider other information, too. For instance, we've identified 1 warning sign for Yue Yuen Industrial (Holdings) that you should be aware of.
Of course, you might find a fantastic investment by looking elsewhere. So take a peek at this free list of companies we expect will grow earnings.
Please note, the market returns quoted in this article reflect the market weighted average returns of stocks that currently trade on Hong Kong exchanges.
New: Manage All Your Stock Portfolios in One Place
We've created the ultimate portfolio companion for stock investors, and it's free.
• Connect an unlimited number of Portfolios and see your total in one currency
• Be alerted to new Warning Signs or Risks via email or mobile
• Track the Fair Value of your stocks
Have feedback on this article? Concerned about the content? Get in touch with us directly. Alternatively, email editorial-team (at) simplywallst.com.
This article by Simply Wall St is general in nature. We provide commentary based on historical data and analyst forecasts only using an unbiased methodology and our articles are not intended to be financial advice. It does not constitute a recommendation to buy or sell any stock, and does not take account of your objectives, or your financial situation. We aim to bring you long-term focused analysis driven by fundamental data. Note that our analysis may not factor in the latest price-sensitive company announcements or qualitative material. Simply Wall St has no position in any stocks mentioned.
About SEHK:551
Yue Yuen Industrial (Holdings)
An investment holding company, manufactures and sells athletic, athleisure, casual, and outdoor footwear in the People’s Republic of China, rest of Asia, the United States, Europe, and internationally.
Flawless balance sheet and undervalued.

