
Advertisement
- Hong Kong
- /
- Consumer Durables
- /
- SEHK:496
Be Wary Of Kasen International Holdings (HKG:496) And Its Returns On Capital
If you're not sure where to start when looking for the next multi-bagger, there are a few key trends you should keep an eye out for. Amongst other things, we'll want to see two things; firstly, a growing return on capital employed (ROCE) and secondly, an expansion in the company's amount of capital employed. This shows us that it's a compounding machine, able to continually reinvest its earnings back into the business and generate higher returns. However, after investigating Kasen International Holdings (HKG:496), we don't think it's current trends fit the mold of a multi-bagger.
Return On Capital Employed (ROCE): What Is It?
Just to clarify if you're unsure, ROCE is a metric for evaluating how much pre-tax income (in percentage terms) a company earns on the capital invested in its business. To calculate this metric for Kasen International Holdings, this is the formula:
Return on Capital Employed = Earnings Before Interest and Tax (EBIT) ÷ (Total Assets - Current Liabilities)
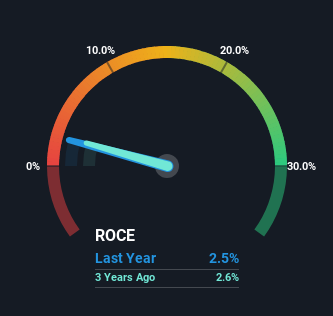
0.025 = CN¥106m ÷ (CN¥6.0b - CN¥1.7b) (Based on the trailing twelve months to December 2023).
Thus, Kasen International Holdings has an ROCE of 2.5%. In absolute terms, that's a low return and it also under-performs the Consumer Durables industry average of 11%.
View our latest analysis for Kasen International Holdings
While the past is not representative of the future, it can be helpful to know how a company has performed historically, which is why we have this chart above. If you're interested in investigating Kasen International Holdings' past further, check out this free graph covering Kasen International Holdings' past earnings, revenue and cash flow.
What Can We Tell From Kasen International Holdings' ROCE Trend?
When we looked at the ROCE trend at Kasen International Holdings, we didn't gain much confidence. Around five years ago the returns on capital were 16%, but since then they've fallen to 2.5%. Although, given both revenue and the amount of assets employed in the business have increased, it could suggest the company is investing in growth, and the extra capital has led to a short-term reduction in ROCE. If these investments prove successful, this can bode very well for long term stock performance.
On a side note, Kasen International Holdings has done well to pay down its current liabilities to 28% of total assets. So we could link some of this to the decrease in ROCE. Effectively this means their suppliers or short-term creditors are funding less of the business, which reduces some elements of risk. Since the business is basically funding more of its operations with it's own money, you could argue this has made the business less efficient at generating ROCE.
The Bottom Line
While returns have fallen for Kasen International Holdings in recent times, we're encouraged to see that sales are growing and that the business is reinvesting in its operations. But since the stock has dived 96% in the last five years, there could be other drivers that are influencing the business' outlook. Regardless, reinvestment can pay off in the long run, so we think astute investors may want to look further into this stock.
On a final note, we found 2 warning signs for Kasen International Holdings (1 can't be ignored) you should be aware of.
For those who like to invest in solid companies, check out this free list of companies with solid balance sheets and high returns on equity.
Valuation is complex, but we're here to simplify it.
Discover if Kasen International Holdings might be undervalued or overvalued with our detailed analysis, featuring fair value estimates, potential risks, dividends, insider trades, and its financial condition.
Access Free AnalysisHave feedback on this article? Concerned about the content? Get in touch with us directly. Alternatively, email editorial-team (at) simplywallst.com.
This article by Simply Wall St is general in nature. We provide commentary based on historical data and analyst forecasts only using an unbiased methodology and our articles are not intended to be financial advice. It does not constitute a recommendation to buy or sell any stock, and does not take account of your objectives, or your financial situation. We aim to bring you long-term focused analysis driven by fundamental data. Note that our analysis may not factor in the latest price-sensitive company announcements or qualitative material. Simply Wall St has no position in any stocks mentioned.
Have feedback on this article? Concerned about the content? Get in touch with us directly. Alternatively, email editorial-team@simplywallst.com
About SEHK:496
Kasen International Holdings
An investment holding company, engages in manufacturing and trading of upholstered furniture in the United States, the People’s Republic of China, Hong Kong, Cambodia, Europe, and internationally.
Excellent balance sheet with low risk.
Market Insights

Advertisement
Community Narratives
MicroVision will explode future revenue by 380.37% with a vision towards success
Fair Value US$60.00|98.4% undervalued
TH
Community Contributor
The Indispensable Artery for a New North American Economy
Fair Value CA$132.87|1.1% undervalued
TI
Community Contributor