If You Had Bought Speed Apparel Holding (HKG:3860) Stock Three Years Ago, You Could Pocket A 56% Gain Today
By buying an index fund, you can roughly match the market return with ease. But if you choose individual stocks with prowess, you can make superior returns. Just take a look at Speed Apparel Holding Limited (HKG:3860), which is up 56%, over three years, soundly beating the market decline of 8.1% (not including dividends).
View our latest analysis for Speed Apparel Holding
To paraphrase Benjamin Graham: Over the short term the market is a voting machine, but over the long term it's a weighing machine. One imperfect but simple way to consider how the market perception of a company has shifted is to compare the change in the earnings per share (EPS) with the share price movement.
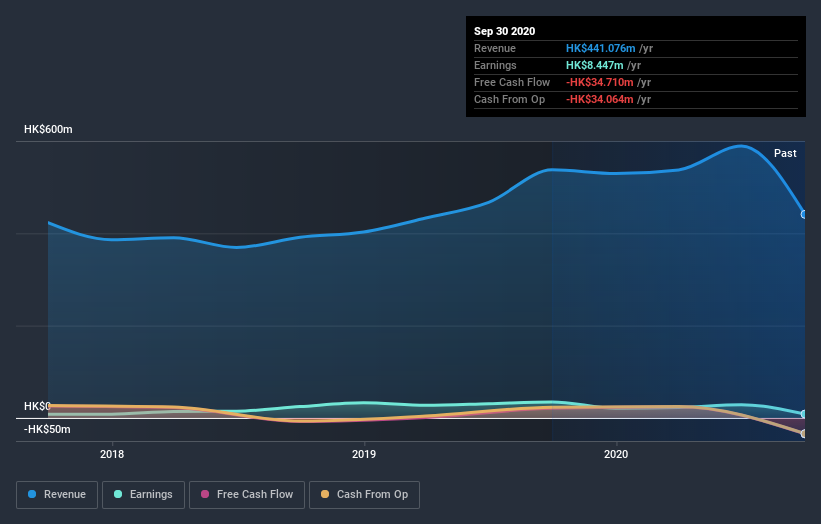
Over the last three years, Speed Apparel Holding failed to grow earnings per share, which fell 3.2% (annualized).
Companies are not always focussed on EPS growth in the short term, and looking at how the share price has reacted, we don't think EPS is the most important metric for Speed Apparel Holding at the moment. So other metrics may hold the key to understanding what is influencing investors.
It may well be that Speed Apparel Holding revenue growth rate of 12% over three years has convinced shareholders to believe in a brighter future. If the company is being managed for the long term good, today's shareholders might be right to hold on.
You can see below how earnings and revenue have changed over time (discover the exact values by clicking on the image).

If you are thinking of buying or selling Speed Apparel Holding stock, you should check out this FREE detailed report on its balance sheet.
What about the Total Shareholder Return (TSR)?
Investors should note that there's a difference between Speed Apparel Holding's total shareholder return (TSR) and its share price change, which we've covered above. The TSR is a return calculation that accounts for the value of cash dividends (assuming that any dividend received was reinvested) and the calculated value of any discounted capital raisings and spin-offs. Its history of dividend payouts mean that Speed Apparel Holding's TSR of 65% over the last 3 years is better than the share price return.
A Different Perspective
It's nice to see that Speed Apparel Holding shareholders have gained 51% (in total) over the last year. That gain actually surpasses the 18% TSR it generated (per year) over three years. These improved returns may hint at some real business momentum, implying that now could be a great time to delve deeper. I find it very interesting to look at share price over the long term as a proxy for business performance. But to truly gain insight, we need to consider other information, too. For example, we've discovered 4 warning signs for Speed Apparel Holding (1 is significant!) that you should be aware of before investing here.
But note: Speed Apparel Holding may not be the best stock to buy. So take a peek at this free list of interesting companies with past earnings growth (and further growth forecast).
Please note, the market returns quoted in this article reflect the market weighted average returns of stocks that currently trade on HK exchanges.
If you’re looking to trade Speed Apparel Holding, open an account with the lowest-cost* platform trusted by professionals, Interactive Brokers. Their clients from over 200 countries and territories trade stocks, options, futures, forex, bonds and funds worldwide from a single integrated account. Promoted
Valuation is complex, but we're here to simplify it.
Discover if EPS Creative Health Technology Group might be undervalued or overvalued with our detailed analysis, featuring fair value estimates, potential risks, dividends, insider trades, and its financial condition.
Access Free AnalysisThis article by Simply Wall St is general in nature. It does not constitute a recommendation to buy or sell any stock, and does not take account of your objectives, or your financial situation. We aim to bring you long-term focused analysis driven by fundamental data. Note that our analysis may not factor in the latest price-sensitive company announcements or qualitative material. Simply Wall St has no position in any stocks mentioned.
*Interactive Brokers Rated Lowest Cost Broker by StockBrokers.com Annual Online Review 2020
Have feedback on this article? Concerned about the content? Get in touch with us directly. Alternatively, email editorial-team (at) simplywallst.com.
About SEHK:3860
EPS Creative Health Technology Group
An investment holding company, operates as an apparel supply chain management service provider in Hong Kong, Mainland China, Japan, the United States, Europe, and internationally.
Slight risk with mediocre balance sheet.
Similar Companies
Market Insights
Community Narratives


