
Advertisement
Revenues Not Telling The Story For EPS Creative Health Technology Group Limited (HKG:3860)
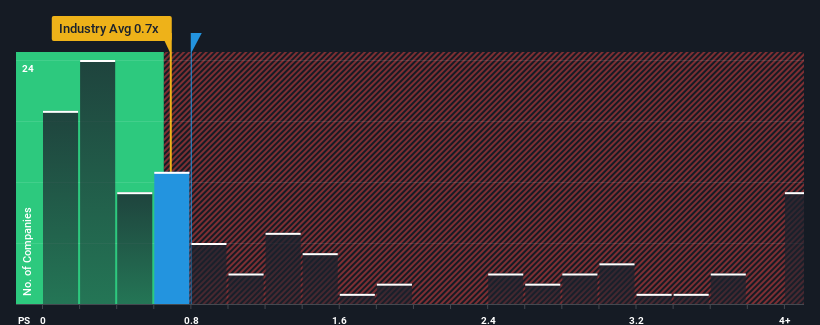
With a median price-to-sales (or "P/S") ratio of close to 0.7x in the Luxury industry in Hong Kong, you could be forgiven for feeling indifferent about EPS Creative Health Technology Group Limited's (HKG:3860) P/S ratio of 0.8x. While this might not raise any eyebrows, if the P/S ratio is not justified investors could be missing out on a potential opportunity or ignoring looming disappointment.
Check out our latest analysis for EPS Creative Health Technology Group
How Has EPS Creative Health Technology Group Performed Recently?
The recent revenue growth at EPS Creative Health Technology Group would have to be considered satisfactory if not spectacular. One possibility is that the P/S is moderate because investors think this good revenue growth might only be parallel to the broader industry in the near future. Those who are bullish on EPS Creative Health Technology Group will be hoping that this isn't the case, so that they can pick up the stock at a lower valuation.
We don't have analyst forecasts, but you can see how recent trends are setting up the company for the future by checking out our free report on EPS Creative Health Technology Group's earnings, revenue and cash flow.Do Revenue Forecasts Match The P/S Ratio?
In order to justify its P/S ratio, EPS Creative Health Technology Group would need to produce growth that's similar to the industry.
Retrospectively, the last year delivered a decent 3.7% gain to the company's revenues. Revenue has also lifted 25% in aggregate from three years ago, partly thanks to the last 12 months of growth. Therefore, it's fair to say the revenue growth recently has been respectable for the company.
Comparing that to the industry, which is predicted to deliver 12% growth in the next 12 months, the company's momentum is weaker, based on recent medium-term annualised revenue results.
In light of this, it's curious that EPS Creative Health Technology Group's P/S sits in line with the majority of other companies. Apparently many investors in the company are less bearish than recent times would indicate and aren't willing to let go of their stock right now. Maintaining these prices will be difficult to achieve as a continuation of recent revenue trends is likely to weigh down the shares eventually.
The Bottom Line On EPS Creative Health Technology Group's P/S
We'd say the price-to-sales ratio's power isn't primarily as a valuation instrument but rather to gauge current investor sentiment and future expectations.
Our examination of EPS Creative Health Technology Group revealed its poor three-year revenue trends aren't resulting in a lower P/S as per our expectations, given they look worse than current industry outlook. Right now we are uncomfortable with the P/S as this revenue performance isn't likely to support a more positive sentiment for long. Unless the recent medium-term conditions improve, it's hard to accept the current share price as fair value.
You should always think about risks. Case in point, we've spotted 2 warning signs for EPS Creative Health Technology Group you should be aware of, and 1 of them shouldn't be ignored.
If these risks are making you reconsider your opinion on EPS Creative Health Technology Group, explore our interactive list of high quality stocks to get an idea of what else is out there.
Valuation is complex, but we're here to simplify it.
Discover if EPS Creative Health Technology Group might be undervalued or overvalued with our detailed analysis, featuring fair value estimates, potential risks, dividends, insider trades, and its financial condition.
Access Free AnalysisHave feedback on this article? Concerned about the content? Get in touch with us directly. Alternatively, email editorial-team (at) simplywallst.com.
This article by Simply Wall St is general in nature. We provide commentary based on historical data and analyst forecasts only using an unbiased methodology and our articles are not intended to be financial advice. It does not constitute a recommendation to buy or sell any stock, and does not take account of your objectives, or your financial situation. We aim to bring you long-term focused analysis driven by fundamental data. Note that our analysis may not factor in the latest price-sensitive company announcements or qualitative material. Simply Wall St has no position in any stocks mentioned.
About SEHK:3860
EPS Creative Health Technology Group
An investment holding company, operates as an apparel supply chain management service provider in Hong Kong, Mainland China, Japan, the United States, Europe, and internationally.
Slight risk with mediocre balance sheet.
Similar Companies
Market Insights

Advertisement
Community Narratives
The company that turned a verb into a global necessity and basically runs the modern internet, digital ads, smartphones, maps, and AI.
Fair Value US$300.00|6.3% undervalued
OS
Community Contributor
Flowers Foods Pays A Fair Price For Health
Fair Value US$16.12|26.0% undervalued
NV
Community Contributor
TMX Group will thrive with 33.3% profit margin and enduring market moat
Fair Value CA$49.90|3.7% overvalued
LI
Community Contributor