
Advertisement
More Unpleasant Surprises Could Be In Store For EPS Creative Health Technology Group Limited's (HKG:3860) Shares After Tumbling 28%
EPS Creative Health Technology Group Limited (HKG:3860) shareholders that were waiting for something to happen have been dealt a blow with a 28% share price drop in the last month. Instead of being rewarded, shareholders who have already held through the last twelve months are now sitting on a 29% share price drop.
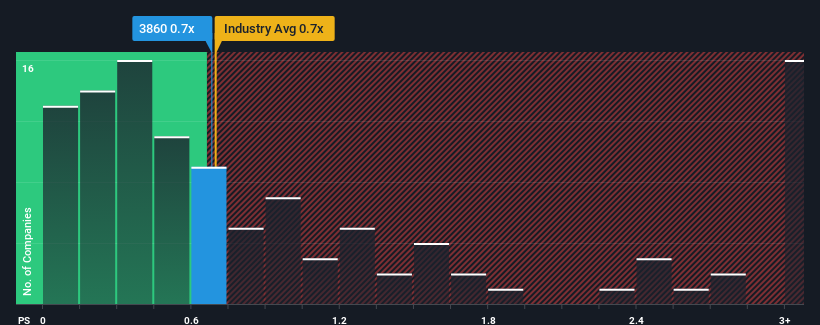
In spite of the heavy fall in price, it's still not a stretch to say that EPS Creative Health Technology Group's price-to-sales (or "P/S") ratio of 0.7x right now seems quite "middle-of-the-road" compared to the Luxury industry in Hong Kong, seeing as it matches the P/S ratio of the wider industry. However, investors might be overlooking a clear opportunity or potential setback if there is no rational basis for the P/S.
View our latest analysis for EPS Creative Health Technology Group
What Does EPS Creative Health Technology Group's Recent Performance Look Like?
Revenue has risen at a steady rate over the last year for EPS Creative Health Technology Group, which is generally not a bad outcome. Perhaps the expectation moving forward is that the revenue growth will track in line with the wider industry for the near term, which has kept the P/S subdued. If you like the company, you'd be hoping this isn't the case so that you could potentially pick up some stock while it's not quite in favour.
Want the full picture on earnings, revenue and cash flow for the company? Then our free report on EPS Creative Health Technology Group will help you shine a light on its historical performance.How Is EPS Creative Health Technology Group's Revenue Growth Trending?
EPS Creative Health Technology Group's P/S ratio would be typical for a company that's only expected to deliver moderate growth, and importantly, perform in line with the industry.
Taking a look back first, we see that the company managed to grow revenues by a handy 3.7% last year. The latest three year period has also seen a 25% overall rise in revenue, aided somewhat by its short-term performance. Accordingly, shareholders would have probably been satisfied with the medium-term rates of revenue growth.
Comparing the recent medium-term revenue trends against the industry's one-year growth forecast of 13% shows it's noticeably less attractive.
With this in mind, we find it intriguing that EPS Creative Health Technology Group's P/S is comparable to that of its industry peers. Apparently many investors in the company are less bearish than recent times would indicate and aren't willing to let go of their stock right now. They may be setting themselves up for future disappointment if the P/S falls to levels more in line with recent growth rates.
The Final Word
Following EPS Creative Health Technology Group's share price tumble, its P/S is just clinging on to the industry median P/S. We'd say the price-to-sales ratio's power isn't primarily as a valuation instrument but rather to gauge current investor sentiment and future expectations.
We've established that EPS Creative Health Technology Group's average P/S is a bit surprising since its recent three-year growth is lower than the wider industry forecast. Right now we are uncomfortable with the P/S as this revenue performance isn't likely to support a more positive sentiment for long. Unless the recent medium-term conditions improve, it's hard to accept the current share price as fair value.
Plus, you should also learn about these 3 warning signs we've spotted with EPS Creative Health Technology Group (including 1 which is significant).
If strong companies turning a profit tickle your fancy, then you'll want to check out this free list of interesting companies that trade on a low P/E (but have proven they can grow earnings).
Valuation is complex, but we're here to simplify it.
Discover if EPS Creative Health Technology Group might be undervalued or overvalued with our detailed analysis, featuring fair value estimates, potential risks, dividends, insider trades, and its financial condition.
Access Free AnalysisHave feedback on this article? Concerned about the content? Get in touch with us directly. Alternatively, email editorial-team (at) simplywallst.com.
This article by Simply Wall St is general in nature. We provide commentary based on historical data and analyst forecasts only using an unbiased methodology and our articles are not intended to be financial advice. It does not constitute a recommendation to buy or sell any stock, and does not take account of your objectives, or your financial situation. We aim to bring you long-term focused analysis driven by fundamental data. Note that our analysis may not factor in the latest price-sensitive company announcements or qualitative material. Simply Wall St has no position in any stocks mentioned.
Have feedback on this article? Concerned about the content? Get in touch with us directly. Alternatively, email editorial-team@simplywallst.com
About SEHK:3860
EPS Creative Health Technology Group
An investment holding company, operates as an apparel supply chain management service provider in Hong Kong, Mainland China, Japan, the United States, Europe, and internationally.
Slight risk with mediocre balance sheet.
Similar Companies
Market Insights

Advertisement
Community Narratives
The company that turned a verb into a global necessity and basically runs the modern internet, digital ads, smartphones, maps, and AI.
Fair Value US$300.00|5.2% undervalued
OS
Community Contributor
Flowers Foods Pays A Fair Price For Health
Fair Value US$16.12|24.9% undervalued
NV
Community Contributor
TMX Group will thrive with 33.3% profit margin and enduring market moat
Fair Value CA$49.90|3.3% overvalued
LI
Community Contributor
The "Molecular Pencil": Why Beam's Technology is Built to Win
Fair Value US$65.01|64.5% undervalued
DA
Community Contributor