
Advertisement
Risks Still Elevated At These Prices As Grown Up Group Investment Holdings Limited (HKG:1842) Shares Dive 27%
To the annoyance of some shareholders, Grown Up Group Investment Holdings Limited (HKG:1842) shares are down a considerable 27% in the last month, which continues a horrid run for the company. For any long-term shareholders, the last month ends a year to forget by locking in a 57% share price decline.
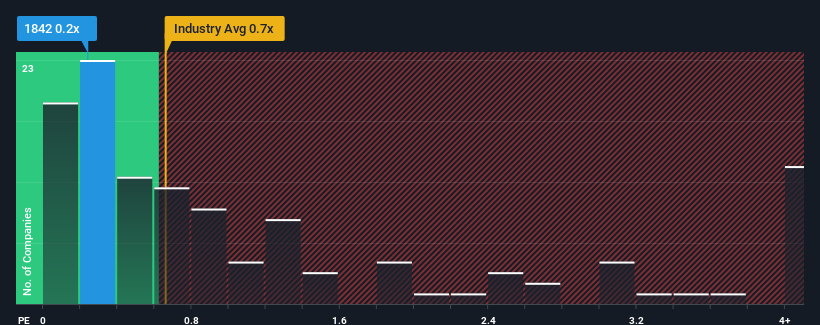
Although its price has dipped substantially, there still wouldn't be many who think Grown Up Group Investment Holdings' price-to-sales (or "P/S") ratio of 0.2x is worth a mention when the median P/S in Hong Kong's Luxury industry is similar at about 0.7x. Although, it's not wise to simply ignore the P/S without explanation as investors may be disregarding a distinct opportunity or a costly mistake.
See our latest analysis for Grown Up Group Investment Holdings
How Has Grown Up Group Investment Holdings Performed Recently?
For instance, Grown Up Group Investment Holdings' receding revenue in recent times would have to be some food for thought. One possibility is that the P/S is moderate because investors think the company might still do enough to be in line with the broader industry in the near future. If not, then existing shareholders may be a little nervous about the viability of the share price.
Want the full picture on earnings, revenue and cash flow for the company? Then our free report on Grown Up Group Investment Holdings will help you shine a light on its historical performance.Do Revenue Forecasts Match The P/S Ratio?
There's an inherent assumption that a company should be matching the industry for P/S ratios like Grown Up Group Investment Holdings' to be considered reasonable.
Retrospectively, the last year delivered a frustrating 26% decrease to the company's top line. This has soured the latest three-year period, which nevertheless managed to deliver a decent 5.4% overall rise in revenue. Although it's been a bumpy ride, it's still fair to say the revenue growth recently has been mostly respectable for the company.
Comparing the recent medium-term revenue trends against the industry's one-year growth forecast of 12% shows it's noticeably less attractive.
In light of this, it's curious that Grown Up Group Investment Holdings' P/S sits in line with the majority of other companies. It seems most investors are ignoring the fairly limited recent growth rates and are willing to pay up for exposure to the stock. Maintaining these prices will be difficult to achieve as a continuation of recent revenue trends is likely to weigh down the shares eventually.
What We Can Learn From Grown Up Group Investment Holdings' P/S?
Following Grown Up Group Investment Holdings' share price tumble, its P/S is just clinging on to the industry median P/S. While the price-to-sales ratio shouldn't be the defining factor in whether you buy a stock or not, it's quite a capable barometer of revenue expectations.
We've established that Grown Up Group Investment Holdings' average P/S is a bit surprising since its recent three-year growth is lower than the wider industry forecast. When we see weak revenue with slower than industry growth, we suspect the share price is at risk of declining, bringing the P/S back in line with expectations. If recent medium-term revenue trends continue, the probability of a share price decline will become quite substantial, placing shareholders at risk.
Before you settle on your opinion, we've discovered 3 warning signs for Grown Up Group Investment Holdings (2 are potentially serious!) that you should be aware of.
If you're unsure about the strength of Grown Up Group Investment Holdings' business, why not explore our interactive list of stocks with solid business fundamentals for some other companies you may have missed.
New: Manage All Your Stock Portfolios in One Place
We've created the ultimate portfolio companion for stock investors, and it's free.
• Connect an unlimited number of Portfolios and see your total in one currency
• Be alerted to new Warning Signs or Risks via email or mobile
• Track the Fair Value of your stocks
Have feedback on this article? Concerned about the content? Get in touch with us directly. Alternatively, email editorial-team (at) simplywallst.com.
This article by Simply Wall St is general in nature. We provide commentary based on historical data and analyst forecasts only using an unbiased methodology and our articles are not intended to be financial advice. It does not constitute a recommendation to buy or sell any stock, and does not take account of your objectives, or your financial situation. We aim to bring you long-term focused analysis driven by fundamental data. Note that our analysis may not factor in the latest price-sensitive company announcements or qualitative material. Simply Wall St has no position in any stocks mentioned.
Have feedback on this article? Concerned about the content? Get in touch with us directly. Alternatively, email editorial-team@simplywallst.com
About SEHK:1842
Grown Up Group Investment Holdings
Engages in the design, development, manufacture, trading and sale of bags and luggage products and accessories in Hong Kong, Europe, North America, the People’s Republic of China, Asia-Pacific, and internationally.
Adequate balance sheet and slightly overvalued.
Market Insights

Advertisement
Community Narratives
MicroVision will explode future revenue by 380.37% with a vision towards success
Fair Value US$60.00|98.3% undervalued
TH
Community Contributor
The Indispensable Artery for a New North American Economy
Fair Value CA$132.87|1.0% undervalued
TI
Community Contributor