
Advertisement
- Hong Kong
- /
- Consumer Durables
- /
- SEHK:1412
Q P Group Holdings' (HKG:1412) Returns On Capital Not Reflecting Well On The Business
What are the early trends we should look for to identify a stock that could multiply in value over the long term? Firstly, we'll want to see a proven return on capital employed (ROCE) that is increasing, and secondly, an expanding base of capital employed. Ultimately, this demonstrates that it's a business that is reinvesting profits at increasing rates of return. Although, when we looked at Q P Group Holdings (HKG:1412), it didn't seem to tick all of these boxes.
What Is Return On Capital Employed (ROCE)?
For those who don't know, ROCE is a measure of a company's yearly pre-tax profit (its return), relative to the capital employed in the business. Analysts use this formula to calculate it for Q P Group Holdings:
Return on Capital Employed = Earnings Before Interest and Tax (EBIT) ÷ (Total Assets - Current Liabilities)
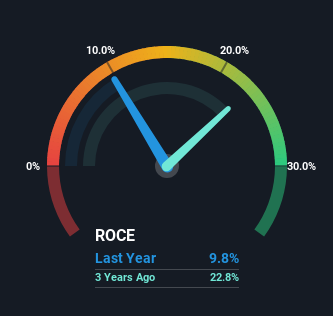
0.098 = HK$83m ÷ (HK$1.1b - HK$240m) (Based on the trailing twelve months to December 2023).
Thus, Q P Group Holdings has an ROCE of 9.8%. In absolute terms, that's a low return but it's around the Consumer Durables industry average of 11%.
See our latest analysis for Q P Group Holdings
While the past is not representative of the future, it can be helpful to know how a company has performed historically, which is why we have this chart above. If you want to delve into the historical earnings , check out these free graphs detailing revenue and cash flow performance of Q P Group Holdings.
So How Is Q P Group Holdings' ROCE Trending?
When we looked at the ROCE trend at Q P Group Holdings, we didn't gain much confidence. Over the last five years, returns on capital have decreased to 9.8% from 13% five years ago. Given the business is employing more capital while revenue has slipped, this is a bit concerning. If this were to continue, you might be looking at a company that is trying to reinvest for growth but is actually losing market share since sales haven't increased.
On a side note, Q P Group Holdings has done well to pay down its current liabilities to 22% of total assets. That could partly explain why the ROCE has dropped. What's more, this can reduce some aspects of risk to the business because now the company's suppliers or short-term creditors are funding less of its operations. Since the business is basically funding more of its operations with it's own money, you could argue this has made the business less efficient at generating ROCE.
The Bottom Line On Q P Group Holdings' ROCE
In summary, we're somewhat concerned by Q P Group Holdings' diminishing returns on increasing amounts of capital. In spite of that, the stock has delivered a 5.8% return to shareholders who held over the last three years. Regardless, we don't like the trends as they are and if they persist, we think you might find better investments elsewhere.
On a final note, we've found 2 warning signs for Q P Group Holdings that we think you should be aware of.
If you want to search for solid companies with great earnings, check out this free list of companies with good balance sheets and impressive returns on equity.
Valuation is complex, but we're here to simplify it.
Discover if Q P Group Holdings might be undervalued or overvalued with our detailed analysis, featuring fair value estimates, potential risks, dividends, insider trades, and its financial condition.
Access Free AnalysisHave feedback on this article? Concerned about the content? Get in touch with us directly. Alternatively, email editorial-team (at) simplywallst.com.
This article by Simply Wall St is general in nature. We provide commentary based on historical data and analyst forecasts only using an unbiased methodology and our articles are not intended to be financial advice. It does not constitute a recommendation to buy or sell any stock, and does not take account of your objectives, or your financial situation. We aim to bring you long-term focused analysis driven by fundamental data. Note that our analysis may not factor in the latest price-sensitive company announcements or qualitative material. Simply Wall St has no position in any stocks mentioned.
Have feedback on this article? Concerned about the content? Get in touch with us directly. Alternatively, email editorial-team@simplywallst.com
About SEHK:1412
Q P Group Holdings
An investment holding company, manufactures and trades in paper products in the People’s Republic of China, the United States, Europe, and internationally.
Flawless balance sheet with proven track record.
Market Insights

Advertisement
Community Narratives
The company that turned a verb into a global necessity and basically runs the modern internet, digital ads, smartphones, maps, and AI.
Fair Value US$300.00|6.3% undervalued
OS
Community Contributor
Flowers Foods Pays A Fair Price For Health
Fair Value US$16.12|26.0% undervalued
NV
Community Contributor
TMX Group will thrive with 33.3% profit margin and enduring market moat
Fair Value CA$49.90|3.7% overvalued
LI
Community Contributor