
Advertisement
- Hong Kong
- /
- Professional Services
- /
- SEHK:6113
UTS Marketing Solutions Holdings (HKG:6113) Knows How To Allocate Capital Effectively
What trends should we look for it we want to identify stocks that can multiply in value over the long term? In a perfect world, we'd like to see a company investing more capital into its business and ideally the returns earned from that capital are also increasing. This shows us that it's a compounding machine, able to continually reinvest its earnings back into the business and generate higher returns. So when we looked at the ROCE trend of UTS Marketing Solutions Holdings (HKG:6113) we really liked what we saw.
Understanding Return On Capital Employed (ROCE)
If you haven't worked with ROCE before, it measures the 'return' (pre-tax profit) a company generates from capital employed in its business. Analysts use this formula to calculate it for UTS Marketing Solutions Holdings:
Return on Capital Employed = Earnings Before Interest and Tax (EBIT) ÷ (Total Assets - Current Liabilities)
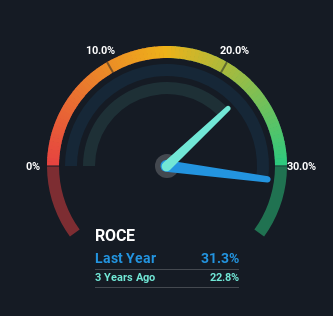
0.31 = RM15m ÷ (RM69m - RM20m) (Based on the trailing twelve months to June 2024).
Therefore, UTS Marketing Solutions Holdings has an ROCE of 31%. That's a fantastic return and not only that, it outpaces the average of 6.2% earned by companies in a similar industry.
See our latest analysis for UTS Marketing Solutions Holdings
While the past is not representative of the future, it can be helpful to know how a company has performed historically, which is why we have this chart above. If you'd like to look at how UTS Marketing Solutions Holdings has performed in the past in other metrics, you can view this free graph of UTS Marketing Solutions Holdings' past earnings, revenue and cash flow.
So How Is UTS Marketing Solutions Holdings' ROCE Trending?
You'd find it hard not to be impressed with the ROCE trend at UTS Marketing Solutions Holdings. We found that the returns on capital employed over the last five years have risen by 133%. That's a very favorable trend because this means that the company is earning more per dollar of capital that's being employed. Speaking of capital employed, the company is actually utilizing 37% less than it was five years ago, which can be indicative of a business that's improving its efficiency. UTS Marketing Solutions Holdings may be selling some assets so it's worth investigating if the business has plans for future investments to increase returns further still.
For the record though, there was a noticeable increase in the company's current liabilities over the period, so we would attribute some of the ROCE growth to that. The current liabilities has increased to 28% of total assets, so the business is now more funded by the likes of its suppliers or short-term creditors. It's worth keeping an eye on this because as the percentage of current liabilities to total assets increases, some aspects of risk also increase.
The Key Takeaway
From what we've seen above, UTS Marketing Solutions Holdings has managed to increase it's returns on capital all the while reducing it's capital base. Investors may not be impressed by the favorable underlying trends yet because over the last five years the stock has only returned 40% to shareholders. So with that in mind, we think the stock deserves further research.
One more thing: We've identified 3 warning signs with UTS Marketing Solutions Holdings (at least 1 which makes us a bit uncomfortable) , and understanding these would certainly be useful.
If you'd like to see other companies earning high returns, check out our free list of companies earning high returns with solid balance sheets here.
Valuation is complex, but we're here to simplify it.
Discover if BitStrat Holdings might be undervalued or overvalued with our detailed analysis, featuring fair value estimates, potential risks, dividends, insider trades, and its financial condition.
Access Free AnalysisHave feedback on this article? Concerned about the content? Get in touch with us directly. Alternatively, email editorial-team (at) simplywallst.com.
This article by Simply Wall St is general in nature. We provide commentary based on historical data and analyst forecasts only using an unbiased methodology and our articles are not intended to be financial advice. It does not constitute a recommendation to buy or sell any stock, and does not take account of your objectives, or your financial situation. We aim to bring you long-term focused analysis driven by fundamental data. Note that our analysis may not factor in the latest price-sensitive company announcements or qualitative material. Simply Wall St has no position in any stocks mentioned.
About SEHK:6113
BitStrat Holdings
An investment holding company, provides outbound telemarketing services and contact center facilities in Malaysia.
Excellent balance sheet with questionable track record.
Market Insights

Advertisement
Community Narratives
The company that turned a verb into a global necessity and basically runs the modern internet, digital ads, smartphones, maps, and AI.
Fair Value US$300.00|6.2% undervalued
OS
Community Contributor
Flowers Foods Pays A Fair Price For Health
Fair Value US$16.12|26.0% undervalued
NV
Community Contributor
TMX Group will thrive with 33.3% profit margin and enduring market moat
Fair Value CA$49.90|3.7% overvalued
LI
Community Contributor