
Advertisement
- Hong Kong
- /
- Commercial Services
- /
- SEHK:1955
The Returns On Capital At Hong Kong Johnson Holdings (HKG:1955) Don't Inspire Confidence
Finding a business that has the potential to grow substantially is not easy, but it is possible if we look at a few key financial metrics. Amongst other things, we'll want to see two things; firstly, a growing return on capital employed (ROCE) and secondly, an expansion in the company's amount of capital employed. Ultimately, this demonstrates that it's a business that is reinvesting profits at increasing rates of return. Having said that, from a first glance at Hong Kong Johnson Holdings (HKG:1955) we aren't jumping out of our chairs at how returns are trending, but let's have a deeper look.
Understanding Return On Capital Employed (ROCE)
For those that aren't sure what ROCE is, it measures the amount of pre-tax profits a company can generate from the capital employed in its business. To calculate this metric for Hong Kong Johnson Holdings, this is the formula:
Return on Capital Employed = Earnings Before Interest and Tax (EBIT) ÷ (Total Assets - Current Liabilities)
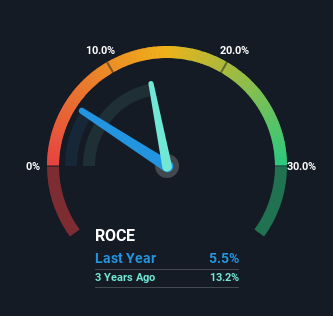
0.055 = HK$34m ÷ (HK$950m - HK$329m) (Based on the trailing twelve months to March 2023).
Thus, Hong Kong Johnson Holdings has an ROCE of 5.5%. In absolute terms, that's a low return and it also under-performs the Commercial Services industry average of 8.2%.
View our latest analysis for Hong Kong Johnson Holdings
While the past is not representative of the future, it can be helpful to know how a company has performed historically, which is why we have this chart above. If you're interested in investigating Hong Kong Johnson Holdings' past further, check out this free graph of past earnings, revenue and cash flow.
The Trend Of ROCE
When we looked at the ROCE trend at Hong Kong Johnson Holdings, we didn't gain much confidence. Around five years ago the returns on capital were 27%, but since then they've fallen to 5.5%. Given the business is employing more capital while revenue has slipped, this is a bit concerning. This could mean that the business is losing its competitive advantage or market share, because while more money is being put into ventures, it's actually producing a lower return - "less bang for their buck" per se.
On a side note, Hong Kong Johnson Holdings has done well to pay down its current liabilities to 35% of total assets. So we could link some of this to the decrease in ROCE. What's more, this can reduce some aspects of risk to the business because now the company's suppliers or short-term creditors are funding less of its operations. Since the business is basically funding more of its operations with it's own money, you could argue this has made the business less efficient at generating ROCE.
What We Can Learn From Hong Kong Johnson Holdings' ROCE
We're a bit apprehensive about Hong Kong Johnson Holdings because despite more capital being deployed in the business, returns on that capital and sales have both fallen. Investors haven't taken kindly to these developments, since the stock has declined 19% from where it was three years ago. Unless there is a shift to a more positive trajectory in these metrics, we would look elsewhere.
If you want to continue researching Hong Kong Johnson Holdings, you might be interested to know about the 3 warning signs that our analysis has discovered.
If you want to search for solid companies with great earnings, check out this free list of companies with good balance sheets and impressive returns on equity.
Valuation is complex, but we're here to simplify it.
Discover if Hong Kong Johnson Holdings might be undervalued or overvalued with our detailed analysis, featuring fair value estimates, potential risks, dividends, insider trades, and its financial condition.
Access Free AnalysisHave feedback on this article? Concerned about the content? Get in touch with us directly. Alternatively, email editorial-team (at) simplywallst.com.
This article by Simply Wall St is general in nature. We provide commentary based on historical data and analyst forecasts only using an unbiased methodology and our articles are not intended to be financial advice. It does not constitute a recommendation to buy or sell any stock, and does not take account of your objectives, or your financial situation. We aim to bring you long-term focused analysis driven by fundamental data. Note that our analysis may not factor in the latest price-sensitive company announcements or qualitative material. Simply Wall St has no position in any stocks mentioned.
About SEHK:1955
Hong Kong Johnson Holdings
An investment holding company, engages in the provision of cleaning, janitorial, and other related services for government and non-government sector in Hong Kong.
Excellent balance sheet with low risk.
Market Insights

Advertisement
Community Narratives
MicroVision will explode future revenue by 380.37% with a vision towards success
Fair Value US$60.00|98.4% undervalued
TH
Community Contributor
The Indispensable Artery for a New North American Economy
Fair Value CA$132.87|1.3% undervalued
TI
Community Contributor