
Advertisement
- Hong Kong
- /
- Commercial Services
- /
- SEHK:1955
Hong Kong Johnson Holdings (HKG:1955) Could Be Struggling To Allocate Capital
Finding a business that has the potential to grow substantially is not easy, but it is possible if we look at a few key financial metrics. Ideally, a business will show two trends; firstly a growing return on capital employed (ROCE) and secondly, an increasing amount of capital employed. If you see this, it typically means it's a company with a great business model and plenty of profitable reinvestment opportunities. However, after investigating Hong Kong Johnson Holdings (HKG:1955), we don't think it's current trends fit the mold of a multi-bagger.
Return On Capital Employed (ROCE): What Is It?
For those that aren't sure what ROCE is, it measures the amount of pre-tax profits a company can generate from the capital employed in its business. To calculate this metric for Hong Kong Johnson Holdings, this is the formula:
Return on Capital Employed = Earnings Before Interest and Tax (EBIT) ÷ (Total Assets - Current Liabilities)
0.011 = HK$6.5m ÷ (HK$869m - HK$253m) (Based on the trailing twelve months to September 2023).
So, Hong Kong Johnson Holdings has an ROCE of 1.1%. Ultimately, that's a low return and it under-performs the Commercial Services industry average of 7.3%.
View our latest analysis for Hong Kong Johnson Holdings
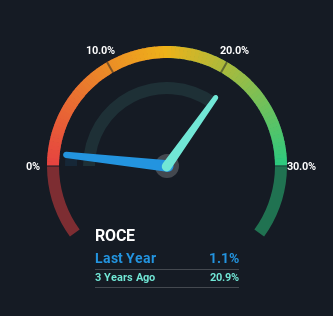
Historical performance is a great place to start when researching a stock so above you can see the gauge for Hong Kong Johnson Holdings' ROCE against it's prior returns. If you're interested in investigating Hong Kong Johnson Holdings' past further, check out this free graph covering Hong Kong Johnson Holdings' past earnings, revenue and cash flow.
How Are Returns Trending?
On the surface, the trend of ROCE at Hong Kong Johnson Holdings doesn't inspire confidence. Over the last five years, returns on capital have decreased to 1.1% from 23% five years ago. And considering revenue has dropped while employing more capital, we'd be cautious. This could mean that the business is losing its competitive advantage or market share, because while more money is being put into ventures, it's actually producing a lower return - "less bang for their buck" per se.
On a side note, Hong Kong Johnson Holdings has done well to pay down its current liabilities to 29% of total assets. That could partly explain why the ROCE has dropped. Effectively this means their suppliers or short-term creditors are funding less of the business, which reduces some elements of risk. Some would claim this reduces the business' efficiency at generating ROCE since it is now funding more of the operations with its own money.
The Bottom Line On Hong Kong Johnson Holdings' ROCE
From the above analysis, we find it rather worrisome that returns on capital and sales for Hong Kong Johnson Holdings have fallen, meanwhile the business is employing more capital than it was five years ago. Long term shareholders who've owned the stock over the last three years have experienced a 55% depreciation in their investment, so it appears the market might not like these trends either. That being the case, unless the underlying trends revert to a more positive trajectory, we'd consider looking elsewhere.
Like most companies, Hong Kong Johnson Holdings does come with some risks, and we've found 3 warning signs that you should be aware of.
While Hong Kong Johnson Holdings may not currently earn the highest returns, we've compiled a list of companies that currently earn more than 25% return on equity. Check out this free list here.
Valuation is complex, but we're here to simplify it.
Discover if Hong Kong Johnson Holdings might be undervalued or overvalued with our detailed analysis, featuring fair value estimates, potential risks, dividends, insider trades, and its financial condition.
Access Free AnalysisHave feedback on this article? Concerned about the content? Get in touch with us directly. Alternatively, email editorial-team (at) simplywallst.com.
This article by Simply Wall St is general in nature. We provide commentary based on historical data and analyst forecasts only using an unbiased methodology and our articles are not intended to be financial advice. It does not constitute a recommendation to buy or sell any stock, and does not take account of your objectives, or your financial situation. We aim to bring you long-term focused analysis driven by fundamental data. Note that our analysis may not factor in the latest price-sensitive company announcements or qualitative material. Simply Wall St has no position in any stocks mentioned.
About SEHK:1955
Hong Kong Johnson Holdings
An investment holding company, engages in the provision of cleaning, janitorial, and other related services for government and non-government sector in Hong Kong.
Excellent balance sheet with low risk.
Market Insights

Advertisement
Community Narratives
MicroVision will explode future revenue by 380.37% with a vision towards success
Fair Value US$60.00|98.5% undervalued
TH
Community Contributor
The Indispensable Artery for a New North American Economy
Fair Value CA$132.87|2.3% undervalued
TI
Community Contributor