
Advertisement
- Hong Kong
- /
- Commercial Services
- /
- SEHK:1850
Investors Give HSC Resources Group Limited (HKG:1850) Shares A 26% Hiding
To the annoyance of some shareholders, HSC Resources Group Limited (HKG:1850) shares are down a considerable 26% in the last month, which continues a horrid run for the company. For any long-term shareholders, the last month ends a year to forget by locking in a 50% share price decline.
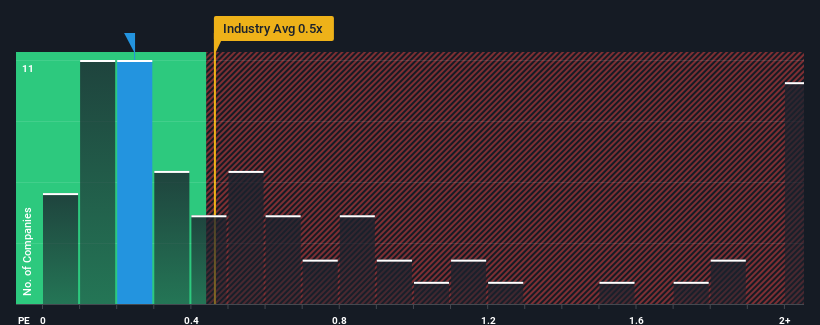
In spite of the heavy fall in price, there still wouldn't be many who think HSC Resources Group's price-to-sales (or "P/S") ratio of 0.2x is worth a mention when the median P/S in Hong Kong's Commercial Services industry is similar at about 0.5x. While this might not raise any eyebrows, if the P/S ratio is not justified investors could be missing out on a potential opportunity or ignoring looming disappointment.
See our latest analysis for HSC Resources Group
What Does HSC Resources Group's Recent Performance Look Like?
With revenue growth that's exceedingly strong of late, HSC Resources Group has been doing very well. The P/S is probably moderate because investors think this strong revenue growth might not be enough to outperform the broader industry in the near future. Those who are bullish on HSC Resources Group will be hoping that this isn't the case, so that they can pick up the stock at a lower valuation.
Although there are no analyst estimates available for HSC Resources Group, take a look at this free data-rich visualisation to see how the company stacks up on earnings, revenue and cash flow.How Is HSC Resources Group's Revenue Growth Trending?
HSC Resources Group's P/S ratio would be typical for a company that's only expected to deliver moderate growth, and importantly, perform in line with the industry.
Retrospectively, the last year delivered an exceptional 68% gain to the company's top line. The latest three year period has also seen an excellent 106% overall rise in revenue, aided by its short-term performance. Therefore, it's fair to say the revenue growth recently has been superb for the company.
This is in contrast to the rest of the industry, which is expected to grow by 5.5% over the next year, materially lower than the company's recent medium-term annualised growth rates.
With this information, we find it interesting that HSC Resources Group is trading at a fairly similar P/S compared to the industry. It may be that most investors are not convinced the company can maintain its recent growth rates.
The Key Takeaway
With its share price dropping off a cliff, the P/S for HSC Resources Group looks to be in line with the rest of the Commercial Services industry. Generally, our preference is to limit the use of the price-to-sales ratio to establishing what the market thinks about the overall health of a company.
We've established that HSC Resources Group currently trades on a lower than expected P/S since its recent three-year growth is higher than the wider industry forecast. It'd be fair to assume that potential risks the company faces could be the contributing factor to the lower than expected P/S. It appears some are indeed anticipating revenue instability, because the persistence of these recent medium-term conditions would normally provide a boost to the share price.
Plus, you should also learn about these 6 warning signs we've spotted with HSC Resources Group (including 3 which can't be ignored).
If companies with solid past earnings growth is up your alley, you may wish to see this free collection of other companies with strong earnings growth and low P/E ratios.
Valuation is complex, but we're here to simplify it.
Discover if HSC Resources Group might be undervalued or overvalued with our detailed analysis, featuring fair value estimates, potential risks, dividends, insider trades, and its financial condition.
Access Free AnalysisHave feedback on this article? Concerned about the content? Get in touch with us directly. Alternatively, email editorial-team (at) simplywallst.com.
This article by Simply Wall St is general in nature. We provide commentary based on historical data and analyst forecasts only using an unbiased methodology and our articles are not intended to be financial advice. It does not constitute a recommendation to buy or sell any stock, and does not take account of your objectives, or your financial situation. We aim to bring you long-term focused analysis driven by fundamental data. Note that our analysis may not factor in the latest price-sensitive company announcements or qualitative material. Simply Wall St has no position in any stocks mentioned.
About SEHK:1850
HSC Resources Group
An investment holding company, operates as a fire service installation contractor in Hong Kong.
Moderate risk with adequate balance sheet.
Market Insights

Advertisement
Community Narratives
The company that turned a verb into a global necessity and basically runs the modern internet, digital ads, smartphones, maps, and AI.
Fair Value US$300.00|6.3% undervalued
OS
Community Contributor
Flowers Foods Pays A Fair Price For Health
Fair Value US$16.12|26.0% undervalued
NV
Community Contributor
TMX Group will thrive with 33.3% profit margin and enduring market moat
Fair Value CA$49.90|3.7% overvalued
LI
Community Contributor