
Advertisement
- Hong Kong
- /
- Commercial Services
- /
- SEHK:1841
A.Plus Group Holdings Limited's (HKG:1841) Stock Has Shown Weakness Lately But Financial Prospects Look Decent: Is The Market Wrong?
With its stock down 25% over the past three months, it is easy to disregard A.Plus Group Holdings (HKG:1841). However, the company's fundamentals look pretty decent, and long-term financials are usually aligned with future market price movements. Particularly, we will be paying attention to A.Plus Group Holdings' ROE today.
Return on equity or ROE is an important factor to be considered by a shareholder because it tells them how effectively their capital is being reinvested. In other words, it is a profitability ratio which measures the rate of return on the capital provided by the company's shareholders.
View our latest analysis for A.Plus Group Holdings
How Do You Calculate Return On Equity?
Return on equity can be calculated by using the formula:
Return on Equity = Net Profit (from continuing operations) ÷ Shareholders' Equity
So, based on the above formula, the ROE for A.Plus Group Holdings is:
20% = HK$20m ÷ HK$101m (Based on the trailing twelve months to March 2023).
The 'return' refers to a company's earnings over the last year. That means that for every HK$1 worth of shareholders' equity, the company generated HK$0.20 in profit.
Why Is ROE Important For Earnings Growth?
So far, we've learned that ROE is a measure of a company's profitability. Depending on how much of these profits the company reinvests or "retains", and how effectively it does so, we are then able to assess a company’s earnings growth potential. Generally speaking, other things being equal, firms with a high return on equity and profit retention, have a higher growth rate than firms that don’t share these attributes.
A.Plus Group Holdings' Earnings Growth And 20% ROE
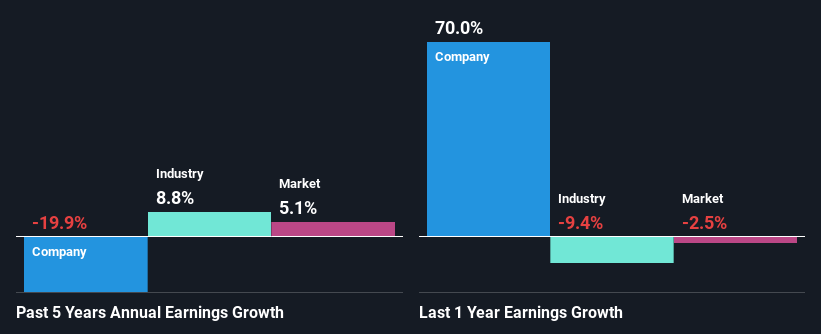
To begin with, A.Plus Group Holdings seems to have a respectable ROE. On comparing with the average industry ROE of 8.9% the company's ROE looks pretty remarkable. For this reason, A.Plus Group Holdings' five year net income decline of 20% raises the question as to why the high ROE didn't translate into earnings growth. Based on this, we feel that there might be other reasons which haven't been discussed so far in this article that could be hampering the company's growth. These include low earnings retention or poor allocation of capital.
So, as a next step, we compared A.Plus Group Holdings' performance against the industry and were disappointed to discover that while the company has been shrinking its earnings, the industry has been growing its earnings at a rate of 8.8% over the last few years.
Earnings growth is an important metric to consider when valuing a stock. It’s important for an investor to know whether the market has priced in the company's expected earnings growth (or decline). Doing so will help them establish if the stock's future looks promising or ominous. Is A.Plus Group Holdings fairly valued compared to other companies? These 3 valuation measures might help you decide.
Is A.Plus Group Holdings Efficiently Re-investing Its Profits?
While the company did payout a portion of its dividend in the past, it currently doesn't pay a dividend. This implies that potentially all of its profits are being reinvested in the business.
Conclusion
In total, it does look like A.Plus Group Holdings has some positive aspects to its business. Although, we are disappointed to see a lack of growth in earnings even in spite of a high ROE and and a high reinvestment rate. We believe that there might be some outside factors that could be having a negative impact on the business. Up till now, we've only made a short study of the company's growth data. You can do your own research on A.Plus Group Holdings and see how it has performed in the past by looking at this FREE detailed graph of past earnings, revenue and cash flows.
New: Manage All Your Stock Portfolios in One Place
We've created the ultimate portfolio companion for stock investors, and it's free.
• Connect an unlimited number of Portfolios and see your total in one currency
• Be alerted to new Warning Signs or Risks via email or mobile
• Track the Fair Value of your stocks
Have feedback on this article? Concerned about the content? Get in touch with us directly. Alternatively, email editorial-team (at) simplywallst.com.
This article by Simply Wall St is general in nature. We provide commentary based on historical data and analyst forecasts only using an unbiased methodology and our articles are not intended to be financial advice. It does not constitute a recommendation to buy or sell any stock, and does not take account of your objectives, or your financial situation. We aim to bring you long-term focused analysis driven by fundamental data. Note that our analysis may not factor in the latest price-sensitive company announcements or qualitative material. Simply Wall St has no position in any stocks mentioned.
About SEHK:1841
A.Plus Group Holdings
An investment holding company, engages in the provision of financial printing services in Hong Kong.
Flawless balance sheet with very low risk.
Market Insights

Advertisement
Weekly Picks
FA

FAI on Arabian Internet and Communication Services ·
Solutions by stc: 34% Upside in Saudi's Digital Transformation Leader
Fair Value:ر.س342.2335.3% undervalued
8 followersusers have followed this narrative
1 commentusers have commented on this narrative
3 likesusers have liked this narrative
RO


RobertoAllende on NVIDIA ·
The AI Infrastructure Giant Grows Into Its Valuation
Fair Value:US$345.0747.9% undervalued
27 followersusers have followed this narrative
28 commentsusers have commented on this narrative
21 likesusers have liked this narrative
Recently Updated Narratives
AB
Abc on Global X Etfs Icav - Global X Silver Miners Ucits ETF ·
Many trends acting at the same time
Fair Value:€10068.5% undervalued
1 followerusers have followed this narrative
0 commentsusers have commented on this narrative
0 likesusers have liked this narrative
NI


niteco on Texas Instruments ·
Engineered for Stability. Positioned for Growth.
Fair Value:US$314.4446.5% undervalued
1 followerusers have followed this narrative
0 commentsusers have commented on this narrative
0 likesusers have liked this narrative
MA


MarkoVT on Applied Digital ·
Staggered by dilution; positions for growth
Fair Value:US$35.4520.4% undervalued
1 followerusers have followed this narrative
0 commentsusers have commented on this narrative
0 likesusers have liked this narrative
Popular Narratives
TH

TheWallstreetKing on MicroVision ·
MicroVision will explode future revenue by 380.37% with a vision towards success
Fair Value:US$6098.4% undervalued
109 followersusers have followed this narrative
11 commentsusers have commented on this narrative
21 likesusers have liked this narrative
AN

AnalystConsensusTarget on NVIDIA ·
NVDA: Expanding AI Demand Will Drive Major Data Center Investments Through 2026
Fair Value:US$250.3928.1% undervalued
939 followersusers have followed this narrative
6 commentsusers have commented on this narrative
24 likesusers have liked this narrative
OS


oscargarcia on Alphabet ·
The company that turned a verb into a global necessity and basically runs the modern internet, digital ads, smartphones, maps, and AI.
Fair Value:US$3407.4% undervalued
145 followersusers have followed this narrative
6 commentsusers have commented on this narrative
18 likesusers have liked this narrative