
Advertisement
- Hong Kong
- /
- Construction
- /
- SEHK:9979
A Look At The Fair Value Of Greentown Management Holdings Company Limited (HKG:9979)
In this article we are going to estimate the intrinsic value of Greentown Management Holdings Company Limited (HKG:9979) by taking the forecast future cash flows of the company and discounting them back to today's value. We will take advantage of the Discounted Cash Flow (DCF) model for this purpose. Don't get put off by the jargon, the math behind it is actually quite straightforward.
We generally believe that a company's value is the present value of all of the cash it will generate in the future. However, a DCF is just one valuation metric among many, and it is not without flaws. If you want to learn more about discounted cash flow, the rationale behind this calculation can be read in detail in the Simply Wall St analysis model.
Check out our latest analysis for Greentown Management Holdings
The calculation
We are going to use a two-stage DCF model, which, as the name states, takes into account two stages of growth. The first stage is generally a higher growth period which levels off heading towards the terminal value, captured in the second 'steady growth' period. To begin with, we have to get estimates of the next ten years of cash flows. Where possible we use analyst estimates, but when these aren't available we extrapolate the previous free cash flow (FCF) from the last estimate or reported value. We assume companies with shrinking free cash flow will slow their rate of shrinkage, and that companies with growing free cash flow will see their growth rate slow, over this period. We do this to reflect that growth tends to slow more in the early years than it does in later years.
Generally we assume that a dollar today is more valuable than a dollar in the future, so we discount the value of these future cash flows to their estimated value in today's dollars:
10-year free cash flow (FCF) forecast
| 2022 | 2023 | 2024 | 2025 | 2026 | 2027 | 2028 | 2029 | 2030 | 2031 | |
| Levered FCF (CN¥, Millions) | CN¥456.5m | CN¥773.0m | CN¥652.1m | CN¥583.6m | CN¥543.3m | CN¥519.4m | CN¥505.8m | CN¥498.7m | CN¥496.0m | CN¥496.4m |
| Growth Rate Estimate Source | Analyst x2 | Analyst x2 | Est @ -15.64% | Est @ -10.5% | Est @ -6.91% | Est @ -4.39% | Est @ -2.63% | Est @ -1.4% | Est @ -0.53% | Est @ 0.07% |
| Present Value (CN¥, Millions) Discounted @ 6.6% | CN¥428 | CN¥680 | CN¥538 | CN¥452 | CN¥394 | CN¥354 | CN¥323 | CN¥299 | CN¥279 | CN¥262 |
("Est" = FCF growth rate estimated by Simply Wall St)
Present Value of 10-year Cash Flow (PVCF) = CN¥4.0b
The second stage is also known as Terminal Value, this is the business's cash flow after the first stage. The Gordon Growth formula is used to calculate Terminal Value at a future annual growth rate equal to the 5-year average of the 10-year government bond yield of 1.5%. We discount the terminal cash flows to today's value at a cost of equity of 6.6%.
Terminal Value (TV)= FCF2031 × (1 + g) ÷ (r – g) = CN¥496m× (1 + 1.5%) ÷ (6.6%– 1.5%) = CN¥9.8b
Present Value of Terminal Value (PVTV)= TV / (1 + r)10= CN¥9.8b÷ ( 1 + 6.6%)10= CN¥5.2b
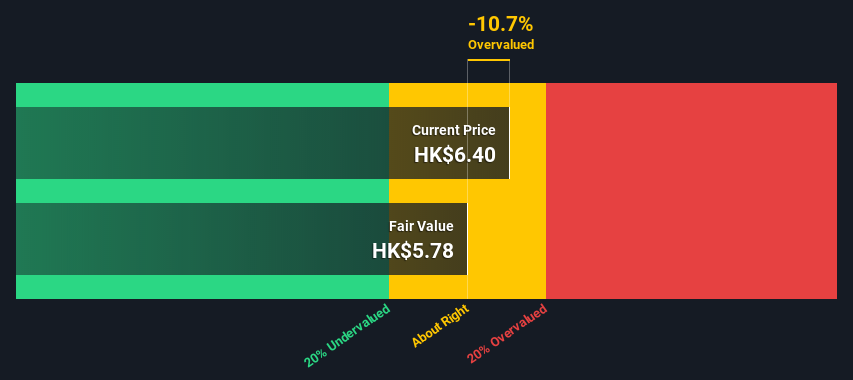
The total value is the sum of cash flows for the next ten years plus the discounted terminal value, which results in the Total Equity Value, which in this case is CN¥9.2b. The last step is to then divide the equity value by the number of shares outstanding. Compared to the current share price of HK$6.4, the company appears around fair value at the time of writing. The assumptions in any calculation have a big impact on the valuation, so it is better to view this as a rough estimate, not precise down to the last cent.
Important assumptions
Now the most important inputs to a discounted cash flow are the discount rate, and of course, the actual cash flows. Part of investing is coming up with your own evaluation of a company's future performance, so try the calculation yourself and check your own assumptions. The DCF also does not consider the possible cyclicality of an industry, or a company's future capital requirements, so it does not give a full picture of a company's potential performance. Given that we are looking at Greentown Management Holdings as potential shareholders, the cost of equity is used as the discount rate, rather than the cost of capital (or weighted average cost of capital, WACC) which accounts for debt. In this calculation we've used 6.6%, which is based on a levered beta of 1.040. Beta is a measure of a stock's volatility, compared to the market as a whole. We get our beta from the industry average beta of globally comparable companies, with an imposed limit between 0.8 and 2.0, which is a reasonable range for a stable business.
Looking Ahead:
Whilst important, the DCF calculation is only one of many factors that you need to assess for a company. It's not possible to obtain a foolproof valuation with a DCF model. Instead the best use for a DCF model is to test certain assumptions and theories to see if they would lead to the company being undervalued or overvalued. For example, changes in the company's cost of equity or the risk free rate can significantly impact the valuation. For Greentown Management Holdings, we've compiled three additional factors you should assess:
- Risks: For example, we've discovered 2 warning signs for Greentown Management Holdings that you should be aware of before investing here.
- Management:Have insiders been ramping up their shares to take advantage of the market's sentiment for 9979's future outlook? Check out our management and board analysis with insights on CEO compensation and governance factors.
- Other High Quality Alternatives: Do you like a good all-rounder? Explore our interactive list of high quality stocks to get an idea of what else is out there you may be missing!
PS. The Simply Wall St app conducts a discounted cash flow valuation for every stock on the SEHK every day. If you want to find the calculation for other stocks just search here.
New: Manage All Your Stock Portfolios in One Place
We've created the ultimate portfolio companion for stock investors, and it's free.
• Connect an unlimited number of Portfolios and see your total in one currency
• Be alerted to new Warning Signs or Risks via email or mobile
• Track the Fair Value of your stocks
Have feedback on this article? Concerned about the content? Get in touch with us directly. Alternatively, email editorial-team (at) simplywallst.com.
This article by Simply Wall St is general in nature. We provide commentary based on historical data and analyst forecasts only using an unbiased methodology and our articles are not intended to be financial advice. It does not constitute a recommendation to buy or sell any stock, and does not take account of your objectives, or your financial situation. We aim to bring you long-term focused analysis driven by fundamental data. Note that our analysis may not factor in the latest price-sensitive company announcements or qualitative material. Simply Wall St has no position in any stocks mentioned.
About SEHK:9979
Greentown Management Holdings
An investment holding company, provides project management services in the People’s Republic of China.
Excellent balance sheet and good value.
Market Insights

Advertisement
Community Narratives
MicroVision will explode future revenue by 380.37% with a vision towards success
Fair Value US$60.00|98.4% undervalued
TH
Community Contributor
The Indispensable Artery for a New North American Economy
Fair Value CA$132.87|1.3% undervalued
TI
Community Contributor