Stock Analysis
- Hong Kong
- /
- Trade Distributors
- /
- SEHK:990
Theme International Holdings' (HKG:990) five-year total shareholder returns outpace the underlying earnings growth


Theme International Holdings Limited (HKG:990) shareholders might be concerned after seeing the share price drop 23% in the last quarter. But that doesn't change the fact that the returns over the last five years have been very strong. Indeed, the share price is up an impressive 214% in that time. To some, the recent pullback wouldn't be surprising after such a fast rise. The more important question is whether the stock is too cheap or too expensive today. While the long term returns are impressive, we do have some sympathy for those who bought more recently, given the 47% drop, in the last year.
In light of the stock dropping 7.1% in the past week, we want to investigate the longer term story, and see if fundamentals have been the driver of the company's positive five-year return.
Check out our latest analysis for Theme International Holdings
To paraphrase Benjamin Graham: Over the short term the market is a voting machine, but over the long term it's a weighing machine. One imperfect but simple way to consider how the market perception of a company has shifted is to compare the change in the earnings per share (EPS) with the share price movement.
During five years of share price growth, Theme International Holdings achieved compound earnings per share (EPS) growth of 63% per year. This EPS growth is higher than the 26% average annual increase in the share price. So one could conclude that the broader market has become more cautious towards the stock. The reasonably low P/E ratio of 5.10 also suggests market apprehension.
The company's earnings per share (over time) is depicted in the image below (click to see the exact numbers).
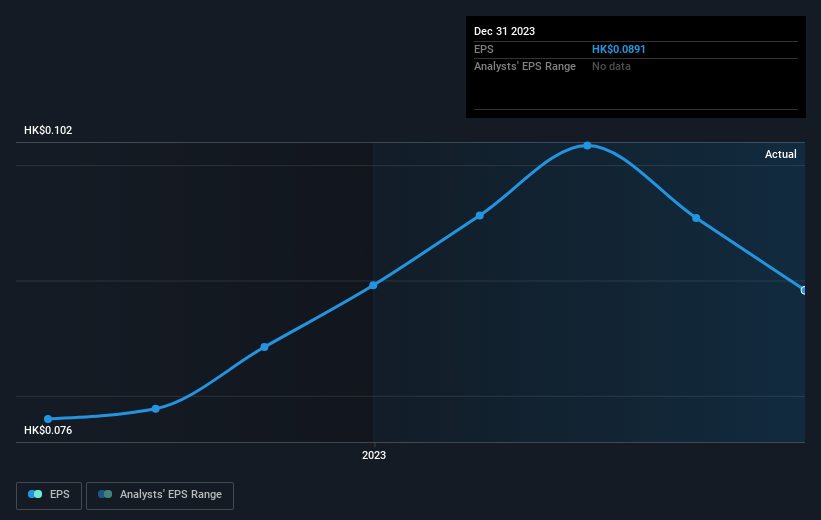
Dive deeper into Theme International Holdings' key metrics by checking this interactive graph of Theme International Holdings's earnings, revenue and cash flow.
What About Dividends?
It is important to consider the total shareholder return, as well as the share price return, for any given stock. Whereas the share price return only reflects the change in the share price, the TSR includes the value of dividends (assuming they were reinvested) and the benefit of any discounted capital raising or spin-off. Arguably, the TSR gives a more comprehensive picture of the return generated by a stock. As it happens, Theme International Holdings' TSR for the last 5 years was 224%, which exceeds the share price return mentioned earlier. This is largely a result of its dividend payments!
A Different Perspective
Theme International Holdings shareholders are down 45% for the year (even including dividends), but the market itself is up 5.8%. Even the share prices of good stocks drop sometimes, but we want to see improvements in the fundamental metrics of a business, before getting too interested. On the bright side, long term shareholders have made money, with a gain of 27% per year over half a decade. If the fundamental data continues to indicate long term sustainable growth, the current sell-off could be an opportunity worth considering. It's always interesting to track share price performance over the longer term. But to understand Theme International Holdings better, we need to consider many other factors. For example, we've discovered 1 warning sign for Theme International Holdings that you should be aware of before investing here.
Of course Theme International Holdings may not be the best stock to buy. So you may wish to see this free collection of growth stocks.
Please note, the market returns quoted in this article reflect the market weighted average returns of stocks that currently trade on Hong Kong exchanges.
Valuation is complex, but we're here to simplify it.
Discover if Theme International Holdings might be undervalued or overvalued with our detailed analysis, featuring fair value estimates, potential risks, dividends, insider trades, and its financial condition.
Access Free AnalysisHave feedback on this article? Concerned about the content? Get in touch with us directly. Alternatively, email editorial-team (at) simplywallst.com.
This article by Simply Wall St is general in nature. We provide commentary based on historical data and analyst forecasts only using an unbiased methodology and our articles are not intended to be financial advice. It does not constitute a recommendation to buy or sell any stock, and does not take account of your objectives, or your financial situation. We aim to bring you long-term focused analysis driven by fundamental data. Note that our analysis may not factor in the latest price-sensitive company announcements or qualitative material. Simply Wall St has no position in any stocks mentioned.
Have feedback on this article? Concerned about the content? Get in touch with us directly. Alternatively, email editorial-team@simplywallst.com
About SEHK:990
Theme International Holdings
An investment holding company, engages in the processing, distribution, and trading of bulk commodities and related products in the People’s Republic of China, Hong Kong, and Singapore.
Flawless balance sheet second-rate dividend payer.
