
Advertisement
- Hong Kong
- /
- Gas Utilities
- /
- SEHK:8007
Global Strategic Group Limited (HKG:8007) Soars 31% But It's A Story Of Risk Vs Reward
Those holding Global Strategic Group Limited (HKG:8007) shares would be relieved that the share price has rebounded 31% in the last thirty days, but it needs to keep going to repair the recent damage it has caused to investor portfolios. Still, the 30-day jump doesn't change the fact that longer term shareholders have seen their stock decimated by the 58% share price drop in the last twelve months.
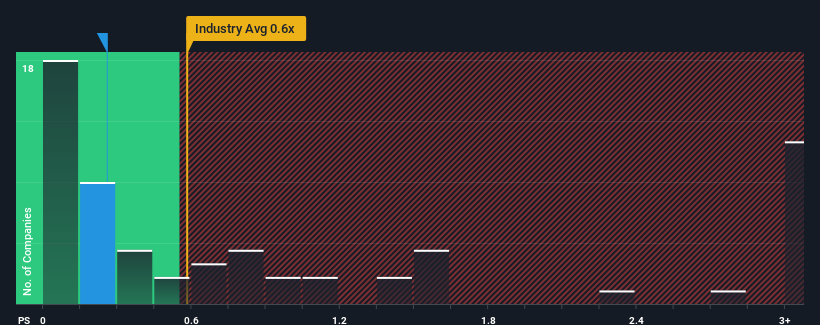
In spite of the firm bounce in price, you could still be forgiven for feeling indifferent about Global Strategic Group's P/S ratio of 0.3x, since the median price-to-sales (or "P/S") ratio for the Trade Distributors industry in Hong Kong is also close to 0.6x. Although, it's not wise to simply ignore the P/S without explanation as investors may be disregarding a distinct opportunity or a costly mistake.
Check out our latest analysis for Global Strategic Group
How Has Global Strategic Group Performed Recently?
The revenue growth achieved at Global Strategic Group over the last year would be more than acceptable for most companies. Perhaps the market is expecting future revenue performance to only keep up with the broader industry, which has keeping the P/S in line with expectations. If you like the company, you'd be hoping this isn't the case so that you could potentially pick up some stock while it's not quite in favour.
Want the full picture on earnings, revenue and cash flow for the company? Then our free report on Global Strategic Group will help you shine a light on its historical performance.Is There Some Revenue Growth Forecasted For Global Strategic Group?
There's an inherent assumption that a company should be matching the industry for P/S ratios like Global Strategic Group's to be considered reasonable.
If we review the last year of revenue growth, the company posted a terrific increase of 22%. The strong recent performance means it was also able to grow revenue by 289% in total over the last three years. Therefore, it's fair to say the revenue growth recently has been superb for the company.
Comparing that recent medium-term revenue trajectory with the industry's one-year growth forecast of 22% shows it's noticeably more attractive.
With this information, we find it interesting that Global Strategic Group is trading at a fairly similar P/S compared to the industry. It may be that most investors are not convinced the company can maintain its recent growth rates.
The Key Takeaway
Global Strategic Group's stock has a lot of momentum behind it lately, which has brought its P/S level with the rest of the industry. Generally, our preference is to limit the use of the price-to-sales ratio to establishing what the market thinks about the overall health of a company.
To our surprise, Global Strategic Group revealed its three-year revenue trends aren't contributing to its P/S as much as we would have predicted, given they look better than current industry expectations. When we see strong revenue with faster-than-industry growth, we can only assume potential risks are what might be placing pressure on the P/S ratio. While recent revenue trends over the past medium-term suggest that the risk of a price decline is low, investors appear to see the likelihood of revenue fluctuations in the future.
Having said that, be aware Global Strategic Group is showing 2 warning signs in our investment analysis, you should know about.
It's important to make sure you look for a great company, not just the first idea you come across. So if growing profitability aligns with your idea of a great company, take a peek at this free list of interesting companies with strong recent earnings growth (and a low P/E).
New: Manage All Your Stock Portfolios in One Place
We've created the ultimate portfolio companion for stock investors, and it's free.
• Connect an unlimited number of Portfolios and see your total in one currency
• Be alerted to new Warning Signs or Risks via email or mobile
• Track the Fair Value of your stocks
Have feedback on this article? Concerned about the content? Get in touch with us directly. Alternatively, email editorial-team (at) simplywallst.com.
This article by Simply Wall St is general in nature. We provide commentary based on historical data and analyst forecasts only using an unbiased methodology and our articles are not intended to be financial advice. It does not constitute a recommendation to buy or sell any stock, and does not take account of your objectives, or your financial situation. We aim to bring you long-term focused analysis driven by fundamental data. Note that our analysis may not factor in the latest price-sensitive company announcements or qualitative material. Simply Wall St has no position in any stocks mentioned.
About SEHK:8007
Global Strategic Group
An investment holding company, supplies natural gas in the People’s Republic of China.
Slightly overvalued with very low risk.
Market Insights

Advertisement
Community Narratives
The company that turned a verb into a global necessity and basically runs the modern internet, digital ads, smartphones, maps, and AI.
Fair Value US$300.00|6.3% undervalued
OS
Community Contributor
Flowers Foods Pays A Fair Price For Health
Fair Value US$16.12|26.0% undervalued
NV
Community Contributor
TMX Group will thrive with 33.3% profit margin and enduring market moat
Fair Value CA$49.90|3.7% overvalued
LI
Community Contributor