Stock Analysis
- Hong Kong
- /
- Construction
- /
- SEHK:2295
Maxicity Holdings Limited's (HKG:2295) Stock's Been Going Strong: Could Weak Financials Mean The Market Will Correct Its Share Price?


Maxicity Holdings' (HKG:2295) stock is up by a considerable 20% over the past month. We, however wanted to have a closer look at its key financial indicators as the markets usually pay for long-term fundamentals, and in this case, they don't look very promising. In this article, we decided to focus on Maxicity Holdings' ROE.
Return on equity or ROE is an important factor to be considered by a shareholder because it tells them how effectively their capital is being reinvested. In short, ROE shows the profit each dollar generates with respect to its shareholder investments.
Check out our latest analysis for Maxicity Holdings
How Is ROE Calculated?
The formula for return on equity is:
Return on Equity = Net Profit (from continuing operations) ÷ Shareholders' Equity
So, based on the above formula, the ROE for Maxicity Holdings is:
9.7% = HK$14m ÷ HK$143m (Based on the trailing twelve months to December 2023).
The 'return' is the income the business earned over the last year. Another way to think of that is that for every HK$1 worth of equity, the company was able to earn HK$0.10 in profit.
What Is The Relationship Between ROE And Earnings Growth?
Thus far, we have learned that ROE measures how efficiently a company is generating its profits. Based on how much of its profits the company chooses to reinvest or "retain", we are then able to evaluate a company's future ability to generate profits. Assuming everything else remains unchanged, the higher the ROE and profit retention, the higher the growth rate of a company compared to companies that don't necessarily bear these characteristics.
Maxicity Holdings' Earnings Growth And 9.7% ROE
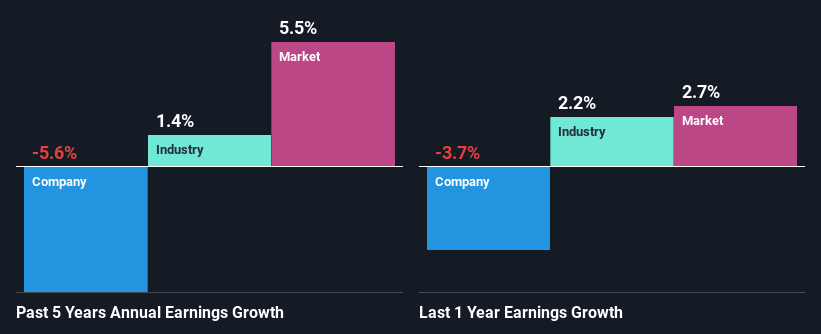
When you first look at it, Maxicity Holdings' ROE doesn't look that attractive. However, the fact that the its ROE is quite higher to the industry average of 6.6% doesn't go unnoticed by us. However, Maxicity Holdings' five year net income decline rate was 5.6%. Bear in mind, the company does have a slightly low ROE. It is just that the industry ROE is lower. So that could be one of the factors that are causing earnings growth to shrink.
So, as a next step, we compared Maxicity Holdings' performance against the industry and were disappointed to discover that while the company has been shrinking its earnings, the industry has been growing its earnings at a rate of 1.4% over the last few years.
Earnings growth is an important metric to consider when valuing a stock. What investors need to determine next is if the expected earnings growth, or the lack of it, is already built into the share price. By doing so, they will have an idea if the stock is headed into clear blue waters or if swampy waters await. Is Maxicity Holdings fairly valued compared to other companies? These 3 valuation measures might help you decide.
Is Maxicity Holdings Using Its Retained Earnings Effectively?
Maxicity Holdings' very high three-year median payout ratio of 239% over the last three years suggests that the company is paying its shareholders more than what it is earning and this explains the company's shrinking earnings. Paying a dividend higher than reported profits is not a sustainable move. You can see the 2 risks we have identified for Maxicity Holdings by visiting our risks dashboard for free on our platform here.
Only recently, Maxicity Holdings stated paying a dividend. This likely means that the management might have concluded that its shareholders have a strong preference for dividends.
Conclusion
In total, we would have a hard think before deciding on any investment action concerning Maxicity Holdings. Its earnings growth particularly is not much to talk about even though it does have a pretty respectable ROE. The lack of growth can be blamed on its poor earnings retention. As discussed earlier, the company is retaining hardly any of its profits. Until now, we have only just grazed the surface of the company's past performance by looking at the company's fundamentals. You can do your own research on Maxicity Holdings and see how it has performed in the past by looking at this FREE detailed graph of past earnings, revenue and cash flows.
New: Manage All Your Stock Portfolios in One Place
We've created the ultimate portfolio companion for stock investors, and it's free.
• Connect an unlimited number of Portfolios and see your total in one currency
• Be alerted to new Warning Signs or Risks via email or mobile
• Track the Fair Value of your stocks
Have feedback on this article? Concerned about the content? Get in touch with us directly. Alternatively, email editorial-team (at) simplywallst.com.
This article by Simply Wall St is general in nature. We provide commentary based on historical data and analyst forecasts only using an unbiased methodology and our articles are not intended to be financial advice. It does not constitute a recommendation to buy or sell any stock, and does not take account of your objectives, or your financial situation. We aim to bring you long-term focused analysis driven by fundamental data. Note that our analysis may not factor in the latest price-sensitive company announcements or qualitative material. Simply Wall St has no position in any stocks mentioned.
Have feedback on this article? Concerned about the content? Get in touch with us directly. Alternatively, email editorial-team@simplywallst.com
About SEHK:2295
Maxicity Holdings
An investment holding company, operates as a slope works contractor in Hong Kong.
Flawless balance sheet very low.
