
Advertisement
- Hong Kong
- /
- Trade Distributors
- /
- SEHK:2098
Returns On Capital Signal Difficult Times Ahead For Zall Smart Commerce Group (HKG:2098)
To avoid investing in a business that's in decline, there's a few financial metrics that can provide early indications of aging. Businesses in decline often have two underlying trends, firstly, a declining return on capital employed (ROCE) and a declining base of capital employed. Ultimately this means that the company is earning less per dollar invested and on top of that, it's shrinking its base of capital employed. Having said that, after a brief look, Zall Smart Commerce Group (HKG:2098) we aren't filled with optimism, but let's investigate further.
Understanding Return On Capital Employed (ROCE)
For those that aren't sure what ROCE is, it measures the amount of pre-tax profits a company can generate from the capital employed in its business. The formula for this calculation on Zall Smart Commerce Group is:
Return on Capital Employed = Earnings Before Interest and Tax (EBIT) ÷ (Total Assets - Current Liabilities)
0.0071 = CN¥168m ÷ (CN¥64b - CN¥40b) (Based on the trailing twelve months to December 2023).
So, Zall Smart Commerce Group has an ROCE of 0.7%. In absolute terms, that's a low return and it also under-performs the Trade Distributors industry average of 6.6%.
Check out our latest analysis for Zall Smart Commerce Group
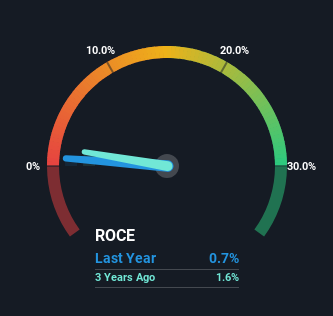
Historical performance is a great place to start when researching a stock so above you can see the gauge for Zall Smart Commerce Group's ROCE against it's prior returns. If you'd like to look at how Zall Smart Commerce Group has performed in the past in other metrics, you can view this free graph of Zall Smart Commerce Group's past earnings, revenue and cash flow.
What Does the ROCE Trend For Zall Smart Commerce Group Tell Us?
The trend of returns that Zall Smart Commerce Group is generating are raising some concerns. To be more specific, today's ROCE was 1.3% five years ago but has since fallen to 0.7%. What's equally concerning is that the amount of capital deployed in the business has shrunk by 20% over that same period. When you see both ROCE and capital employed diminishing, it can often be a sign of a mature and shrinking business that might be in structural decline. If these underlying trends continue, we wouldn't be too optimistic going forward.
On a side note, Zall Smart Commerce Group's current liabilities have increased over the last five years to 63% of total assets, effectively distorting the ROCE to some degree. Without this increase, it's likely that ROCE would be even lower than 0.7%. What this means is that in reality, a rather large portion of the business is being funded by the likes of the company's suppliers or short-term creditors, which can bring some risks of its own.
The Bottom Line On Zall Smart Commerce Group's ROCE
In short, lower returns and decreasing amounts capital employed in the business doesn't fill us with confidence. Long term shareholders who've owned the stock over the last five years have experienced a 66% depreciation in their investment, so it appears the market might not like these trends either. With underlying trends that aren't great in these areas, we'd consider looking elsewhere.
One more thing: We've identified 4 warning signs with Zall Smart Commerce Group (at least 2 which are significant) , and understanding these would certainly be useful.
While Zall Smart Commerce Group may not currently earn the highest returns, we've compiled a list of companies that currently earn more than 25% return on equity. Check out this free list here.
Valuation is complex, but we're here to simplify it.
Discover if Zall Smart Commerce Group might be undervalued or overvalued with our detailed analysis, featuring fair value estimates, potential risks, dividends, insider trades, and its financial condition.
Access Free AnalysisHave feedback on this article? Concerned about the content? Get in touch with us directly. Alternatively, email editorial-team (at) simplywallst.com.
This article by Simply Wall St is general in nature. We provide commentary based on historical data and analyst forecasts only using an unbiased methodology and our articles are not intended to be financial advice. It does not constitute a recommendation to buy or sell any stock, and does not take account of your objectives, or your financial situation. We aim to bring you long-term focused analysis driven by fundamental data. Note that our analysis may not factor in the latest price-sensitive company announcements or qualitative material. Simply Wall St has no position in any stocks mentioned.
Have feedback on this article? Concerned about the content? Get in touch with us directly. Alternatively, email editorial-team@simplywallst.com
About SEHK:2098
Zall Smart Commerce Group
An investment holding company, engages in the supply chain management and trading businesses in the People’s Republic of China and Singapore.
Good value with proven track record.
Market Insights

Advertisement
Community Narratives
The company that turned a verb into a global necessity and basically runs the modern internet, digital ads, smartphones, maps, and AI.
Fair Value US$300.00|6.3% undervalued
OS
Community Contributor
Flowers Foods Pays A Fair Price For Health
Fair Value US$16.12|26.0% undervalued
NV
Community Contributor
TMX Group will thrive with 33.3% profit margin and enduring market moat
Fair Value CA$49.90|3.7% overvalued
LI
Community Contributor