
Advertisement
- Hong Kong
- /
- Construction
- /
- SEHK:1722
Kin Pang Holdings' (HKG:1722) Returns On Capital Not Reflecting Well On The Business
When we're researching a company, it's sometimes hard to find the warning signs, but there are some financial metrics that can help spot trouble early. A business that's potentially in decline often shows two trends, a return on capital employed (ROCE) that's declining, and a base of capital employed that's also declining. Trends like this ultimately mean the business is reducing its investments and also earning less on what it has invested. In light of that, from a first glance at Kin Pang Holdings (HKG:1722), we've spotted some signs that it could be struggling, so let's investigate.
What Is Return On Capital Employed (ROCE)?
Just to clarify if you're unsure, ROCE is a metric for evaluating how much pre-tax income (in percentage terms) a company earns on the capital invested in its business. Analysts use this formula to calculate it for Kin Pang Holdings:
Return on Capital Employed = Earnings Before Interest and Tax (EBIT) ÷ (Total Assets - Current Liabilities)
0.0066 = MO$1.4m ÷ (MO$466m - MO$257m) (Based on the trailing twelve months to June 2023).
So, Kin Pang Holdings has an ROCE of 0.7%. In absolute terms, that's a low return and it also under-performs the Construction industry average of 8.3%.
Check out our latest analysis for Kin Pang Holdings
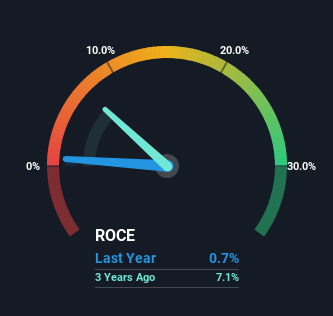
Historical performance is a great place to start when researching a stock so above you can see the gauge for Kin Pang Holdings' ROCE against it's prior returns. If you want to delve into the historical earnings, revenue and cash flow of Kin Pang Holdings, check out these free graphs here.
What Can We Tell From Kin Pang Holdings' ROCE Trend?
There is reason to be cautious about Kin Pang Holdings, given the returns are trending downwards. To be more specific, the ROCE was 11% five years ago, but since then it has dropped noticeably. Meanwhile, capital employed in the business has stayed roughly the flat over the period. Since returns are falling and the business has the same amount of assets employed, this can suggest it's a mature business that hasn't had much growth in the last five years. So because these trends aren't typically conducive to creating a multi-bagger, we wouldn't hold our breath on Kin Pang Holdings becoming one if things continue as they have.
While on the subject, we noticed that the ratio of current liabilities to total assets has risen to 55%, which has impacted the ROCE. If current liabilities hadn't increased as much as they did, the ROCE could actually be even lower. And with current liabilities at these levels, suppliers or short-term creditors are effectively funding a large part of the business, which can introduce some risks.
Our Take On Kin Pang Holdings' ROCE
In summary, it's unfortunate that Kin Pang Holdings is generating lower returns from the same amount of capital. This could explain why the stock has sunk a total of 81% in the last five years. Unless there is a shift to a more positive trajectory in these metrics, we would look elsewhere.
If you'd like to know more about Kin Pang Holdings, we've spotted 4 warning signs, and 3 of them are a bit unpleasant.
While Kin Pang Holdings may not currently earn the highest returns, we've compiled a list of companies that currently earn more than 25% return on equity. Check out this free list here.
Valuation is complex, but we're here to simplify it.
Discover if Kin Pang Holdings might be undervalued or overvalued with our detailed analysis, featuring fair value estimates, potential risks, dividends, insider trades, and its financial condition.
Access Free AnalysisHave feedback on this article? Concerned about the content? Get in touch with us directly. Alternatively, email editorial-team (at) simplywallst.com.
This article by Simply Wall St is general in nature. We provide commentary based on historical data and analyst forecasts only using an unbiased methodology and our articles are not intended to be financial advice. It does not constitute a recommendation to buy or sell any stock, and does not take account of your objectives, or your financial situation. We aim to bring you long-term focused analysis driven by fundamental data. Note that our analysis may not factor in the latest price-sensitive company announcements or qualitative material. Simply Wall St has no position in any stocks mentioned.
About SEHK:1722
Kin Pang Holdings
An investment holding company, engages in the provision of building and ancillary services in Macau and Hong Kong.
Mediocre balance sheet with low risk.
Market Insights

Advertisement
Community Narratives
The company that turned a verb into a global necessity and basically runs the modern internet, digital ads, smartphones, maps, and AI.
Fair Value US$300.00|5.2% undervalued
OS
Community Contributor
Flowers Foods Pays A Fair Price For Health
Fair Value US$16.12|24.9% undervalued
NV
Community Contributor
TMX Group will thrive with 33.3% profit margin and enduring market moat
Fair Value CA$49.90|3.3% overvalued
LI
Community Contributor
The "Molecular Pencil": Why Beam's Technology is Built to Win
Fair Value US$65.01|64.5% undervalued
DA
Community Contributor