
Advertisement
Returns On Capital At Yuk Wing Group Holdings (HKG:1536) Paint An Interesting Picture
Did you know there are some financial metrics that can provide clues of a potential multi-bagger? Amongst other things, we'll want to see two things; firstly, a growing return on capital employed (ROCE) and secondly, an expansion in the company's amount of capital employed. Put simply, these types of businesses are compounding machines, meaning they are continually reinvesting their earnings at ever-higher rates of return. In light of that, when we looked at Yuk Wing Group Holdings (HKG:1536) and its ROCE trend, we weren't exactly thrilled.
What is Return On Capital Employed (ROCE)?
For those that aren't sure what ROCE is, it measures the amount of pre-tax profits a company can generate from the capital employed in its business. Analysts use this formula to calculate it for Yuk Wing Group Holdings:
Return on Capital Employed = Earnings Before Interest and Tax (EBIT) ÷ (Total Assets - Current Liabilities)
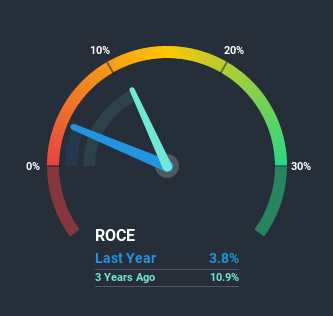
0.038 = HK$8.0m ÷ (HK$255m - HK$43m) (Based on the trailing twelve months to September 2020).
Thus, Yuk Wing Group Holdings has an ROCE of 3.8%. Ultimately, that's a low return and it under-performs the Machinery industry average of 8.7%.
View our latest analysis for Yuk Wing Group Holdings
While the past is not representative of the future, it can be helpful to know how a company has performed historically, which is why we have this chart above. If you want to delve into the historical earnings, revenue and cash flow of Yuk Wing Group Holdings, check out these free graphs here.
So How Is Yuk Wing Group Holdings' ROCE Trending?
In terms of Yuk Wing Group Holdings' historical ROCE movements, the trend isn't fantastic. Over the last five years, returns on capital have decreased to 3.8% from 42% five years ago. Given the business is employing more capital while revenue has slipped, this is a bit concerning. This could mean that the business is losing its competitive advantage or market share, because while more money is being put into ventures, it's actually producing a lower return - "less bang for their buck" per se.
On a side note, Yuk Wing Group Holdings has done well to pay down its current liabilities to 17% of total assets. That could partly explain why the ROCE has dropped. Effectively this means their suppliers or short-term creditors are funding less of the business, which reduces some elements of risk. Some would claim this reduces the business' efficiency at generating ROCE since it is now funding more of the operations with its own money.
In Conclusion...
In summary, we're somewhat concerned by Yuk Wing Group Holdings' diminishing returns on increasing amounts of capital. Unsurprisingly then, the stock has dived 86% over the last three years, so investors are recognizing these changes and don't like the company's prospects. Unless there is a shift to a more positive trajectory in these metrics, we would look elsewhere.
Yuk Wing Group Holdings does have some risks though, and we've spotted 2 warning signs for Yuk Wing Group Holdings that you might be interested in.
While Yuk Wing Group Holdings isn't earning the highest return, check out this free list of companies that are earning high returns on equity with solid balance sheets.
If you’re looking to trade Yuk Wing Group Holdings, open an account with the lowest-cost* platform trusted by professionals, Interactive Brokers. Their clients from over 200 countries and territories trade stocks, options, futures, forex, bonds and funds worldwide from a single integrated account. Promoted
New: Manage All Your Stock Portfolios in One Place
We've created the ultimate portfolio companion for stock investors, and it's free.
• Connect an unlimited number of Portfolios and see your total in one currency
• Be alerted to new Warning Signs or Risks via email or mobile
• Track the Fair Value of your stocks
This article by Simply Wall St is general in nature. It does not constitute a recommendation to buy or sell any stock, and does not take account of your objectives, or your financial situation. We aim to bring you long-term focused analysis driven by fundamental data. Note that our analysis may not factor in the latest price-sensitive company announcements or qualitative material. Simply Wall St has no position in any stocks mentioned.
*Interactive Brokers Rated Lowest Cost Broker by StockBrokers.com Annual Online Review 2020
Have feedback on this article? Concerned about the content? Get in touch with us directly. Alternatively, email editorial-team (at) simplywallst.com.
About SEHK:1536
Yuk Wing Group Holdings
An investment holding company, manufactures and trades in down-the-hole (DTH) rock drilling tools in Hong Kong, Scandinavia, Macau, the People’s Republic of China, Germany, and internationally.
Excellent balance sheet and good value.
Market Insights

Advertisement
Community Narratives
MicroVision will explode future revenue by 380.37% with a vision towards success
Fair Value US$60.00|98.3% undervalued
TH
Community Contributor
The Indispensable Artery for a New North American Economy
Fair Value CA$132.87|1.0% undervalued
TI
Community Contributor