
Advertisement
- Hong Kong
- /
- Auto Components
- /
- SEHK:1241
It's Down 26% But Shuanghua Holdings Limited (HKG:1241) Could Be Riskier Than It Looks
Shuanghua Holdings Limited (HKG:1241) shares have retraced a considerable 26% in the last month, reversing a fair amount of their solid recent performance. Looking at the bigger picture, even after this poor month the stock is up 81% in the last year.
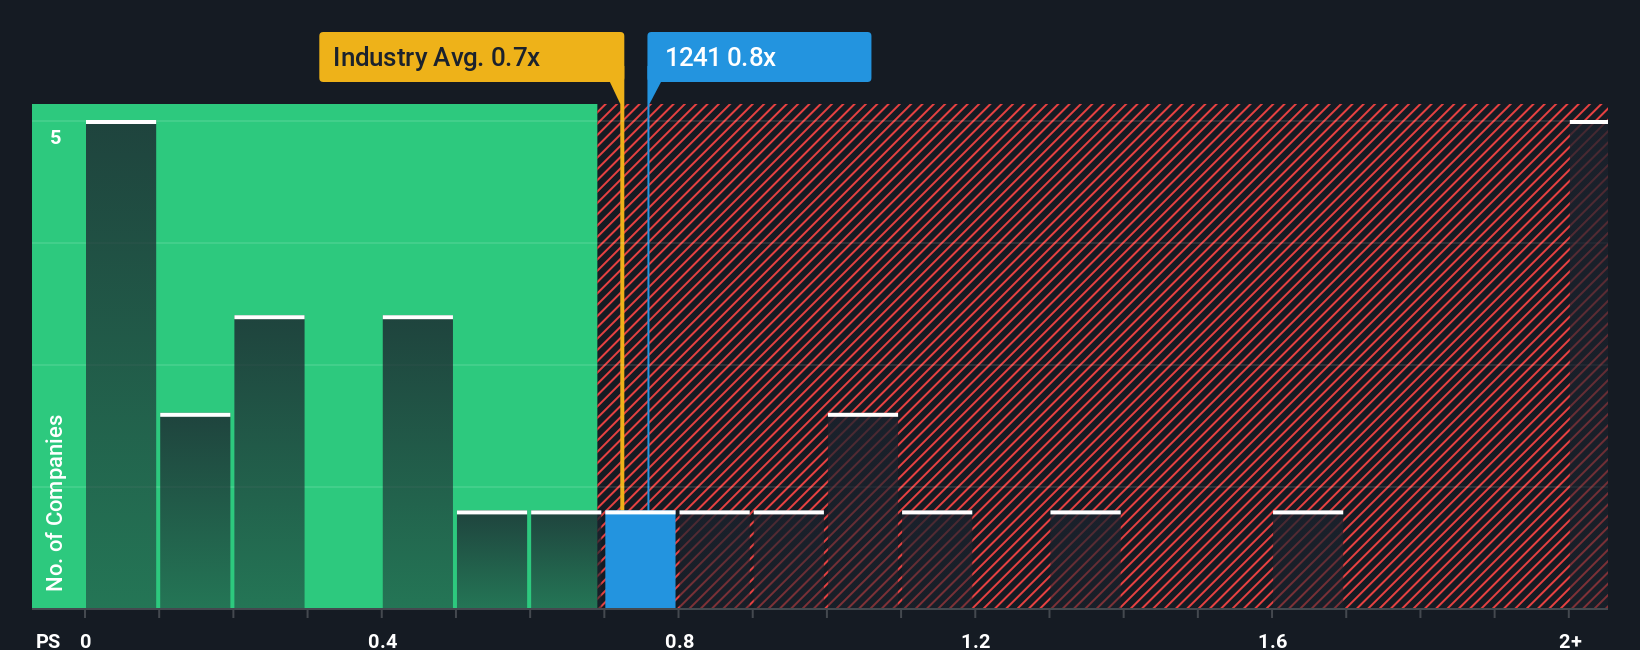
Even after such a large drop in price, there still wouldn't be many who think Shuanghua Holdings' price-to-sales (or "P/S") ratio of 0.8x is worth a mention when the median P/S in Hong Kong's Auto Components industry is similar at about 0.7x. While this might not raise any eyebrows, if the P/S ratio is not justified investors could be missing out on a potential opportunity or ignoring looming disappointment.
View our latest analysis for Shuanghua Holdings
How Has Shuanghua Holdings Performed Recently?
For example, consider that Shuanghua Holdings' financial performance has been poor lately as its revenue has been in decline. One possibility is that the P/S is moderate because investors think the company might still do enough to be in line with the broader industry in the near future. If you like the company, you'd at least be hoping this is the case so that you could potentially pick up some stock while it's not quite in favour.
Although there are no analyst estimates available for Shuanghua Holdings, take a look at this free data-rich visualisation to see how the company stacks up on earnings, revenue and cash flow.What Are Revenue Growth Metrics Telling Us About The P/S?
There's an inherent assumption that a company should be matching the industry for P/S ratios like Shuanghua Holdings' to be considered reasonable.
Taking a look back first, the company's revenue growth last year wasn't something to get excited about as it posted a disappointing decline of 18%. Still, the latest three year period has seen an excellent 153% overall rise in revenue, in spite of its unsatisfying short-term performance. So we can start by confirming that the company has generally done a very good job of growing revenue over that time, even though it had some hiccups along the way.
When compared to the industry's one-year growth forecast of 18%, the most recent medium-term revenue trajectory is noticeably more alluring
In light of this, it's curious that Shuanghua Holdings' P/S sits in line with the majority of other companies. Apparently some shareholders believe the recent performance is at its limits and have been accepting lower selling prices.

What Does Shuanghua Holdings' P/S Mean For Investors?
Shuanghua Holdings' plummeting stock price has brought its P/S back to a similar region as the rest of the industry. Typically, we'd caution against reading too much into price-to-sales ratios when settling on investment decisions, though it can reveal plenty about what other market participants think about the company.
To our surprise, Shuanghua Holdings revealed its three-year revenue trends aren't contributing to its P/S as much as we would have predicted, given they look better than current industry expectations. When we see strong revenue with faster-than-industry growth, we can only assume potential risks are what might be placing pressure on the P/S ratio. While recent revenue trends over the past medium-term suggest that the risk of a price decline is low, investors appear to see the likelihood of revenue fluctuations in the future.
It's always necessary to consider the ever-present spectre of investment risk. We've identified 1 warning sign with Shuanghua Holdings, and understanding should be part of your investment process.
Of course, profitable companies with a history of great earnings growth are generally safer bets. So you may wish to see this free collection of other companies that have reasonable P/E ratios and have grown earnings strongly.
New: Manage All Your Stock Portfolios in One Place
We've created the ultimate portfolio companion for stock investors, and it's free.
• Connect an unlimited number of Portfolios and see your total in one currency
• Be alerted to new Warning Signs or Risks via email or mobile
• Track the Fair Value of your stocks
Have feedback on this article? Concerned about the content? Get in touch with us directly. Alternatively, email editorial-team (at) simplywallst.com.
This article by Simply Wall St is general in nature. We provide commentary based on historical data and analyst forecasts only using an unbiased methodology and our articles are not intended to be financial advice. It does not constitute a recommendation to buy or sell any stock, and does not take account of your objectives, or your financial situation. We aim to bring you long-term focused analysis driven by fundamental data. Note that our analysis may not factor in the latest price-sensitive company announcements or qualitative material. Simply Wall St has no position in any stocks mentioned.
About SEHK:1241
Shuanghua Holdings
An investment holding company, manufactures, imports, exports, and sells automobile air-conditioner parts and components in China.
Flawless balance sheet with low risk.
Market Insights

Advertisement
Community Narratives
MicroVision will explode future revenue by 380.37% with a vision towards success
Fair Value US$60.00|98.4% undervalued
TH
Community Contributor
The Indispensable Artery for a New North American Economy
Fair Value CA$132.87|1.3% undervalued
TI
Community Contributor