Stock Analysis


Today we'll do a simple run through of a valuation method used to estimate the attractiveness of Kre.Ka. S.A. (ATH:KREKA) as an investment opportunity by estimating the company's future cash flows and discounting them to their present value. One way to achieve this is by employing the Discounted Cash Flow (DCF) model. Before you think you won't be able to understand it, just read on! It's actually much less complex than you'd imagine.
We generally believe that a company's value is the present value of all of the cash it will generate in the future. However, a DCF is just one valuation metric among many, and it is not without flaws. If you still have some burning questions about this type of valuation, take a look at the Simply Wall St analysis model.
Check out our latest analysis for Kre.Ka
Step by step through the calculation
We're using the 2-stage growth model, which simply means we take in account two stages of company's growth. In the initial period the company may have a higher growth rate and the second stage is usually assumed to have a stable growth rate. To begin with, we have to get estimates of the next ten years of cash flows. Seeing as no analyst estimates of free cash flow are available to us, we have extrapolate the previous free cash flow (FCF) from the company's last reported value. We assume companies with shrinking free cash flow will slow their rate of shrinkage, and that companies with growing free cash flow will see their growth rate slow, over this period. We do this to reflect that growth tends to slow more in the early years than it does in later years.
A DCF is all about the idea that a dollar in the future is less valuable than a dollar today, so we discount the value of these future cash flows to their estimated value in today's dollars:
10-year free cash flow (FCF) estimate
| 2023 | 2024 | 2025 | 2026 | 2027 | 2028 | 2029 | 2030 | 2031 | 2032 | |
| Levered FCF (€, Millions) | €203.5k | €233.3k | €259.1k | €281.1k | €300.1k | €316.6k | €331.2k | €344.5k | €356.9k | €368.6k |
| Growth Rate Estimate Source | Est @ 19.82% | Est @ 14.66% | Est @ 11.04% | Est @ 8.51% | Est @ 6.74% | Est @ 5.49% | Est @ 4.63% | Est @ 4.02% | Est @ 3.59% | Est @ 3.3% |
| Present Value (€, Millions) Discounted @ 18% | €0.2 | €0.2 | €0.2 | €0.1 | €0.1 | €0.1 | €0.1 | €0.09 | €0.08 | €0.07 |
("Est" = FCF growth rate estimated by Simply Wall St)
Present Value of 10-year Cash Flow (PVCF) = €1.0m
The second stage is also known as Terminal Value, this is the business's cash flow after the first stage. The Gordon Growth formula is used to calculate Terminal Value at a future annual growth rate equal to the 5-year average of the 10-year government bond yield of 2.6%. We discount the terminal cash flows to today's value at a cost of equity of 18%.
Terminal Value (TV)= FCF2032 × (1 + g) ÷ (r – g) = €369k× (1 + 2.6%) ÷ (18%– 2.6%) = €2.4m
Present Value of Terminal Value (PVTV)= TV / (1 + r)10= €2.4m÷ ( 1 + 18%)10= €455k
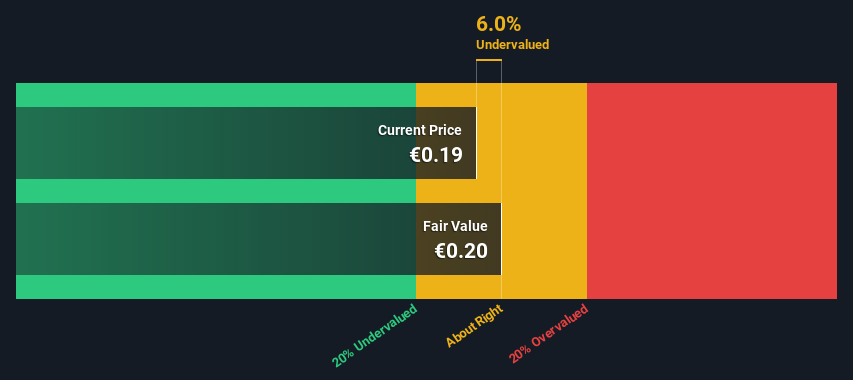
The total value, or equity value, is then the sum of the present value of the future cash flows, which in this case is €1.5m. To get the intrinsic value per share, we divide this by the total number of shares outstanding. Compared to the current share price of €0.2, the company appears about fair value at a 6.0% discount to where the stock price trades currently. Remember though, that this is just an approximate valuation, and like any complex formula - garbage in, garbage out.
The assumptions
The calculation above is very dependent on two assumptions. The first is the discount rate and the other is the cash flows. Part of investing is coming up with your own evaluation of a company's future performance, so try the calculation yourself and check your own assumptions. The DCF also does not consider the possible cyclicality of an industry, or a company's future capital requirements, so it does not give a full picture of a company's potential performance. Given that we are looking at Kre.Ka as potential shareholders, the cost of equity is used as the discount rate, rather than the cost of capital (or weighted average cost of capital, WACC) which accounts for debt. In this calculation we've used 18%, which is based on a levered beta of 2.000. Beta is a measure of a stock's volatility, compared to the market as a whole. We get our beta from the industry average beta of globally comparable companies, with an imposed limit between 0.8 and 2.0, which is a reasonable range for a stable business.
Moving On:
Although the valuation of a company is important, it ideally won't be the sole piece of analysis you scrutinize for a company. It's not possible to obtain a foolproof valuation with a DCF model. Instead the best use for a DCF model is to test certain assumptions and theories to see if they would lead to the company being undervalued or overvalued. If a company grows at a different rate, or if its cost of equity or risk free rate changes sharply, the output can look very different. For Kre.Ka, there are three important factors you should further research:
- Risks: For instance, we've identified 3 warning signs for Kre.Ka that you should be aware of.
- Other High Quality Alternatives: Do you like a good all-rounder? Explore our interactive list of high quality stocks to get an idea of what else is out there you may be missing!
- Other Environmentally-Friendly Companies: Concerned about the environment and think consumers will buy eco-friendly products more and more? Browse through our interactive list of companies that are thinking about a greener future to discover some stocks you may not have thought of!
PS. The Simply Wall St app conducts a discounted cash flow valuation for every stock on the ATSE every day. If you want to find the calculation for other stocks just search here.
Valuation is complex, but we're helping make it simple.
Find out whether Kre.Ka is potentially over or undervalued by checking out our comprehensive analysis, which includes fair value estimates, risks and warnings, dividends, insider transactions and financial health.
View the Free AnalysisHave feedback on this article? Concerned about the content? Get in touch with us directly. Alternatively, email editorial-team (at) simplywallst.com.
This article by Simply Wall St is general in nature. We provide commentary based on historical data and analyst forecasts only using an unbiased methodology and our articles are not intended to be financial advice. It does not constitute a recommendation to buy or sell any stock, and does not take account of your objectives, or your financial situation. We aim to bring you long-term focused analysis driven by fundamental data. Note that our analysis may not factor in the latest price-sensitive company announcements or qualitative material. Simply Wall St has no position in any stocks mentioned.
About ATSE:KREKA
Kre.Ka
Kre.Ka. S.A. engages in breeding, slaughtering, producing, and selling meat products primarily in Greece.
Slightly overvalued with weak fundamentals.
