- Greece
- /
- Oil and Gas
- /
- ATSE:ELPE
HELLENiQ ENERGY Holdings' (ATH:ELPE) earnings growth rate lags the 22% CAGR delivered to shareholders

Low-cost index funds make it easy to achieve average market returns. But in any diversified portfolio of stocks, you'll see some that fall short of the average. For example, the HELLENiQ ENERGY Holdings S.A. (ATH:ELPE) share price return of 37% over three years lags the market return in the same period. Looking at more recent returns, the stock is up 11% in a year.
Although HELLENiQ ENERGY Holdings has shed €125m from its market cap this week, let's take a look at its longer term fundamental trends and see if they've driven returns.
See our latest analysis for HELLENiQ ENERGY Holdings
While markets are a powerful pricing mechanism, share prices reflect investor sentiment, not just underlying business performance. One flawed but reasonable way to assess how sentiment around a company has changed is to compare the earnings per share (EPS) with the share price.
HELLENiQ ENERGY Holdings was able to grow its EPS at 73% per year over three years, sending the share price higher. The average annual share price increase of 11% is actually lower than the EPS growth. Therefore, it seems the market has moderated its expectations for growth, somewhat. We'd venture the lowish P/E ratio of 5.12 also reflects the negative sentiment around the stock.
The company's earnings per share (over time) is depicted in the image below (click to see the exact numbers).
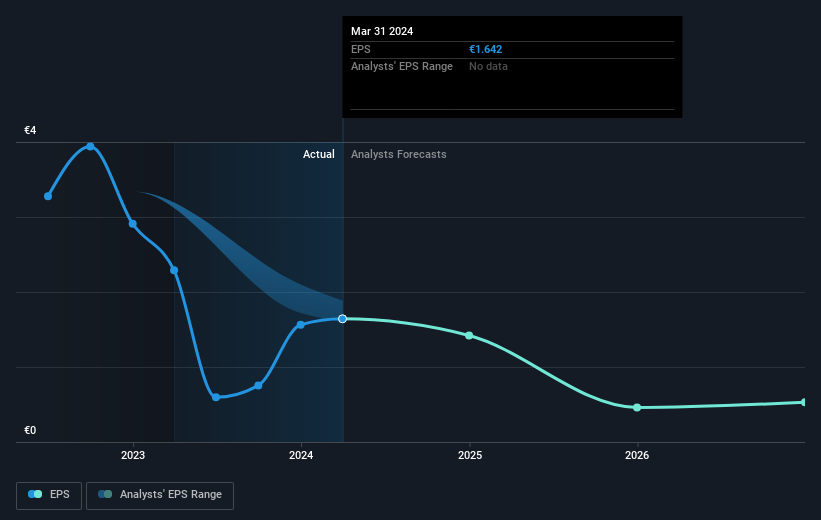
It is of course excellent to see how HELLENiQ ENERGY Holdings has grown profits over the years, but the future is more important for shareholders. If you are thinking of buying or selling HELLENiQ ENERGY Holdings stock, you should check out this FREE detailed report on its balance sheet.
What About Dividends?
As well as measuring the share price return, investors should also consider the total shareholder return (TSR). The TSR is a return calculation that accounts for the value of cash dividends (assuming that any dividend received was reinvested) and the calculated value of any discounted capital raisings and spin-offs. It's fair to say that the TSR gives a more complete picture for stocks that pay a dividend. We note that for HELLENiQ ENERGY Holdings the TSR over the last 3 years was 80%, which is better than the share price return mentioned above. And there's no prize for guessing that the dividend payments largely explain the divergence!
A Different Perspective
HELLENiQ ENERGY Holdings provided a TSR of 23% over the last twelve months. But that return falls short of the market. On the bright side, that's still a gain, and it's actually better than the average return of 8% over half a decade It is possible that returns will improve along with the business fundamentals. While it is well worth considering the different impacts that market conditions can have on the share price, there are other factors that are even more important. To that end, you should learn about the 3 warning signs we've spotted with HELLENiQ ENERGY Holdings (including 2 which are a bit unpleasant) .
If you are like me, then you will not want to miss this free list of undervalued small caps that insiders are buying.
Please note, the market returns quoted in this article reflect the market weighted average returns of stocks that currently trade on Greek exchanges.
Valuation is complex, but we're here to simplify it.
Discover if HELLENiQ ENERGY Holdings might be undervalued or overvalued with our detailed analysis, featuring fair value estimates, potential risks, dividends, insider trades, and its financial condition.
Access Free AnalysisHave feedback on this article? Concerned about the content? Get in touch with us directly. Alternatively, email editorial-team (at) simplywallst.com.
This article by Simply Wall St is general in nature. We provide commentary based on historical data and analyst forecasts only using an unbiased methodology and our articles are not intended to be financial advice. It does not constitute a recommendation to buy or sell any stock, and does not take account of your objectives, or your financial situation. We aim to bring you long-term focused analysis driven by fundamental data. Note that our analysis may not factor in the latest price-sensitive company announcements or qualitative material. Simply Wall St has no position in any stocks mentioned.
About ATSE:ELPE
HELLENiQ ENERGY Holdings
Operates in the energy sector primarily in Greece, the Southeastern Europe, and the East Mediterranean.
Solid track record with excellent balance sheet and pays a dividend.

