- Greece
- /
- Industrials
- /
- ATSE:MYTIL
Mytilineos' (ATH:MYTIL) investors will be pleased with their fantastic 322% return over the last five years


When you buy a stock there is always a possibility that it could drop 100%. But on a lighter note, a good company can see its share price rise well over 100%. For instance, the price of Mytilineos S.A. (ATH:MYTIL) stock is up an impressive 254% over the last five years. It's down 1.9% in the last seven days.
So let's assess the underlying fundamentals over the last 5 years and see if they've moved in lock-step with shareholder returns.
Check out our latest analysis for Mytilineos
While the efficient markets hypothesis continues to be taught by some, it has been proven that markets are over-reactive dynamic systems, and investors are not always rational. One way to examine how market sentiment has changed over time is to look at the interaction between a company's share price and its earnings per share (EPS).
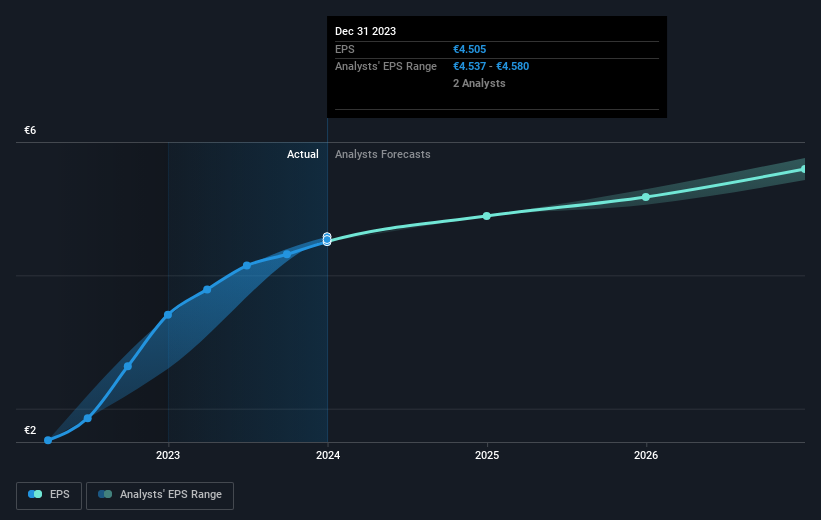
Over half a decade, Mytilineos managed to grow its earnings per share at 35% a year. The EPS growth is more impressive than the yearly share price gain of 29% over the same period. So one could conclude that the broader market has become more cautious towards the stock. The reasonably low P/E ratio of 7.92 also suggests market apprehension.
You can see how EPS has changed over time in the image below (click on the chart to see the exact values).
We know that Mytilineos has improved its bottom line over the last three years, but what does the future have in store? This free interactive report on Mytilineos' balance sheet strength is a great place to start, if you want to investigate the stock further.
What About Dividends?
When looking at investment returns, it is important to consider the difference between total shareholder return (TSR) and share price return. The TSR incorporates the value of any spin-offs or discounted capital raisings, along with any dividends, based on the assumption that the dividends are reinvested. Arguably, the TSR gives a more comprehensive picture of the return generated by a stock. We note that for Mytilineos the TSR over the last 5 years was 322%, which is better than the share price return mentioned above. The dividends paid by the company have thusly boosted the total shareholder return.
A Different Perspective
It's nice to see that Mytilineos shareholders have received a total shareholder return of 16% over the last year. And that does include the dividend. However, that falls short of the 33% TSR per annum it has made for shareholders, each year, over five years. The pessimistic view would be that be that the stock has its best days behind it, but on the other hand the price might simply be moderating while the business itself continues to execute. While it is well worth considering the different impacts that market conditions can have on the share price, there are other factors that are even more important. For example, we've discovered 3 warning signs for Mytilineos (2 are a bit concerning!) that you should be aware of before investing here.
We will like Mytilineos better if we see some big insider buys. While we wait, check out this free list of undervalued stocks (mostly small caps) with considerable, recent, insider buying.
Please note, the market returns quoted in this article reflect the market weighted average returns of stocks that currently trade on Greek exchanges.
New: Manage All Your Stock Portfolios in One Place
We've created the ultimate portfolio companion for stock investors, and it's free.
• Connect an unlimited number of Portfolios and see your total in one currency
• Be alerted to new Warning Signs or Risks via email or mobile
• Track the Fair Value of your stocks
Have feedback on this article? Concerned about the content? Get in touch with us directly. Alternatively, email editorial-team (at) simplywallst.com.
This article by Simply Wall St is general in nature. We provide commentary based on historical data and analyst forecasts only using an unbiased methodology and our articles are not intended to be financial advice. It does not constitute a recommendation to buy or sell any stock, and does not take account of your objectives, or your financial situation. We aim to bring you long-term focused analysis driven by fundamental data. Note that our analysis may not factor in the latest price-sensitive company announcements or qualitative material. Simply Wall St has no position in any stocks mentioned.
Have feedback on this article? Concerned about the content? Get in touch with us directly. Alternatively, email editorial-team@simplywallst.com
About ATSE:MYTIL
Metlen Energy & Metals
Operates in metallurgy, sustainable engineering solution, renewables and storage development, and power and gas sectors in Greece, the European Union, Hellas, and internationally.
Good value with reasonable growth potential.

