
Advertisement
- United Kingdom
- /
- Logistics
- /
- AIM:XPD
Xpediator (LON:XPD) Share Prices Have Dropped 21% In The Last Three Years
Xpediator Plc (LON:XPD) shareholders should be happy to see the share price up 28% in the last quarter. But that cannot eclipse the less-than-impressive returns over the last three years. In fact, the share price is down 21% in the last three years, falling well short of the market return.
View our latest analysis for Xpediator
In his essay The Superinvestors of Graham-and-Doddsville Warren Buffett described how share prices do not always rationally reflect the value of a business. One flawed but reasonable way to assess how sentiment around a company has changed is to compare the earnings per share (EPS) with the share price.
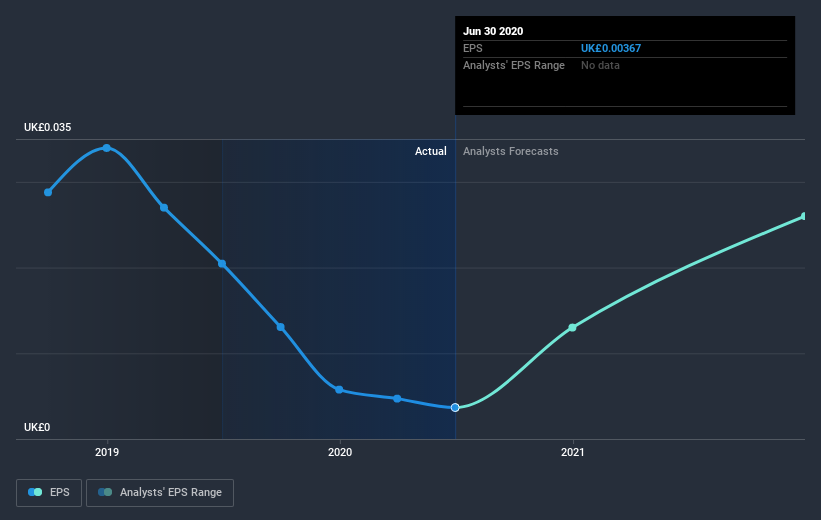
During the three years that the share price fell, Xpediator's earnings per share (EPS) dropped by 36% each year. The recent extraordinary items made their mark on profits. In comparison the 8% compound annual share price decline isn't as bad as the EPS drop-off. So, despite the prior disappointment, shareholders must have some confidence the situation will improve, longer term. With a P/E ratio of 92.64, it's fair to say the market sees a brighter future for the business.
You can see how EPS has changed over time in the image below (click on the chart to see the exact values).
This free interactive report on Xpediator's earnings, revenue and cash flow is a great place to start, if you want to investigate the stock further.
What About Dividends?
As well as measuring the share price return, investors should also consider the total shareholder return (TSR). The TSR is a return calculation that accounts for the value of cash dividends (assuming that any dividend received was reinvested) and the calculated value of any discounted capital raisings and spin-offs. It's fair to say that the TSR gives a more complete picture for stocks that pay a dividend. We note that for Xpediator the TSR over the last 3 years was -17%, which is better than the share price return mentioned above. This is largely a result of its dividend payments!
A Different Perspective
It's nice to see that Xpediator shareholders have gained 7.4% (in total) over the last year. And yes, that does include the dividend. This recent result is much better than the 5% drop suffered by shareholders each year (on average) over the last three. We're generally cautious about putting too much weigh on shorter term data, but the recent improvement is definitely a positive. While it is well worth considering the different impacts that market conditions can have on the share price, there are other factors that are even more important. Case in point: We've spotted 5 warning signs for Xpediator you should be aware of.
If you like to buy stocks alongside management, then you might just love this free list of companies. (Hint: insiders have been buying them).
Please note, the market returns quoted in this article reflect the market weighted average returns of stocks that currently trade on GB exchanges.
When trading Xpediator or any other investment, use the platform considered by many to be the Professional's Gateway to the Worlds Market, Interactive Brokers. You get the lowest-cost* trading on stocks, options, futures, forex, bonds and funds worldwide from a single integrated account. Promoted
New: AI Stock Screener & Alerts
Our new AI Stock Screener scans the market every day to uncover opportunities.
• Dividend Powerhouses (3%+ Yield)
• Undervalued Small Caps with Insider Buying
• High growth Tech and AI Companies
Or build your own from over 50 metrics.
This article by Simply Wall St is general in nature. It does not constitute a recommendation to buy or sell any stock, and does not take account of your objectives, or your financial situation. We aim to bring you long-term focused analysis driven by fundamental data. Note that our analysis may not factor in the latest price-sensitive company announcements or qualitative material. Simply Wall St has no position in any stocks mentioned.
*Interactive Brokers Rated Lowest Cost Broker by StockBrokers.com Annual Online Review 2020
Have feedback on this article? Concerned about the content? Get in touch with us directly. Alternatively, email editorial-team (at) simplywallst.com.
About AIM:XPD
Xpediator
Xpediator Plc, together with its subsidiaries, provides freight management services in the United Kingdom and Europe.
Excellent balance sheet and good value.
Market Insights

Advertisement
Community Narratives
The company that turned a verb into a global necessity and basically runs the modern internet, digital ads, smartphones, maps, and AI.
Fair Value US$300.00|5.1% undervalued
OS
Community Contributor
Flowers Foods Pays A Fair Price For Health
Fair Value US$16.12|27.7% undervalued
NV
Community Contributor
TMX Group will thrive with 33.3% profit margin and enduring market moat
Fair Value CA$49.90|0.2% overvalued
LI
Community Contributor
The "Molecular Pencil": Why Beam's Technology is Built to Win
Fair Value US$65.01|64.4% undervalued
DA
Community Contributor