
Advertisement
- United Kingdom
- /
- Software
- /
- LSE:AVV
Did You Participate In Any Of AVEVA Group's (LON:AVV) Respectable 94% Return?
By buying an index fund, you can roughly match the market return with ease. But if you buy good businesses at attractive prices, your portfolio returns could exceed the average market return. For example, the AVEVA Group plc (LON:AVV) share price is up 51% in the last three years, clearly besting the market decline of around 0.7% (not including dividends). However, more recent returns haven't been as impressive as that, with the stock returning just 22% in the last year , including dividends .
View our latest analysis for AVEVA Group
While the efficient markets hypothesis continues to be taught by some, it has been proven that markets are over-reactive dynamic systems, and investors are not always rational. One imperfect but simple way to consider how the market perception of a company has shifted is to compare the change in the earnings per share (EPS) with the share price movement.
Over the last three years, AVEVA Group failed to grow earnings per share, which fell 34% (annualized).
So we doubt that the market is looking to EPS for its main judge of the company's value. Given this situation, it makes sense to look at other metrics too.
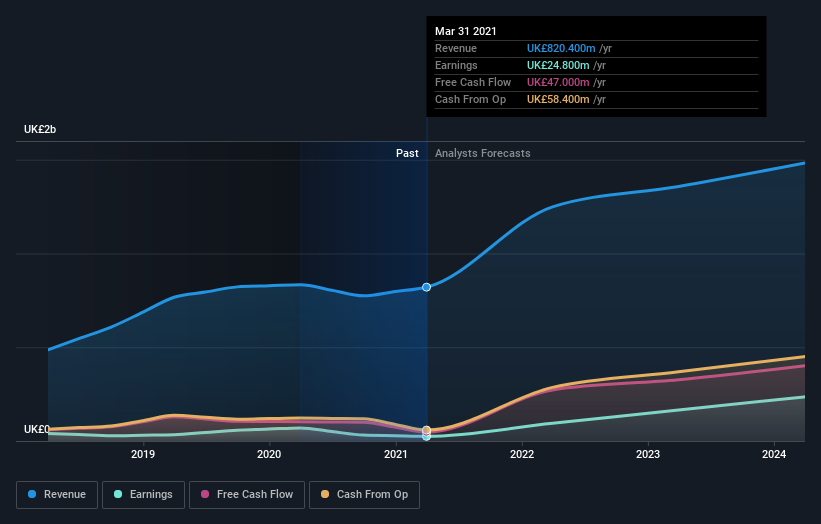
The modest 1.0% dividend yield is unlikely to be propping up the share price. It could be that the revenue growth of 13% per year is viewed as evidence that AVEVA Group is growing. If the company is being managed for the long term good, today's shareholders might be right to hold on.
You can see how earnings and revenue have changed over time in the image below (click on the chart to see the exact values).
It's probably worth noting we've seen significant insider buying in the last quarter, which we consider a positive. On the other hand, we think the revenue and earnings trends are much more meaningful measures of the business. If you are thinking of buying or selling AVEVA Group stock, you should check out this free report showing analyst profit forecasts.
What About Dividends?
It is important to consider the total shareholder return, as well as the share price return, for any given stock. Whereas the share price return only reflects the change in the share price, the TSR includes the value of dividends (assuming they were reinvested) and the benefit of any discounted capital raising or spin-off. So for companies that pay a generous dividend, the TSR is often a lot higher than the share price return. As it happens, AVEVA Group's TSR for the last 3 years was 94%, which exceeds the share price return mentioned earlier. And there's no prize for guessing that the dividend payments largely explain the divergence!
A Different Perspective
AVEVA Group shareholders have gained 22% over twelve months (even including dividends). This isn't far from the market return of 24%. Notably, the longer term shareholders are better off with their TSR of 25% per year over the last three years. Share price gains are anything but steady, so it's a positive to see that the longer term returns are reasonable. It's always interesting to track share price performance over the longer term. But to understand AVEVA Group better, we need to consider many other factors. Even so, be aware that AVEVA Group is showing 3 warning signs in our investment analysis , and 1 of those is potentially serious...
AVEVA Group is not the only stock insiders are buying. So take a peek at this free list of growing companies with insider buying.
Please note, the market returns quoted in this article reflect the market weighted average returns of stocks that currently trade on GB exchanges.
When trading AVEVA Group or any other investment, use the platform considered by many to be the Professional's Gateway to the Worlds Market, Interactive Brokers. You get the lowest-cost* trading on stocks, options, futures, forex, bonds and funds worldwide from a single integrated account. Promoted
New: Manage All Your Stock Portfolios in One Place
We've created the ultimate portfolio companion for stock investors, and it's free.
• Connect an unlimited number of Portfolios and see your total in one currency
• Be alerted to new Warning Signs or Risks via email or mobile
• Track the Fair Value of your stocks
This article by Simply Wall St is general in nature. It does not constitute a recommendation to buy or sell any stock, and does not take account of your objectives, or your financial situation. We aim to bring you long-term focused analysis driven by fundamental data. Note that our analysis may not factor in the latest price-sensitive company announcements or qualitative material. Simply Wall St has no position in any stocks mentioned.
*Interactive Brokers Rated Lowest Cost Broker by StockBrokers.com Annual Online Review 2020
Have feedback on this article? Concerned about the content? Get in touch with us directly. Alternatively, email editorial-team (at) simplywallst.com.
About LSE:AVV
AVEVA Group
AVEVA Group plc, through its subsidiaries, provides engineering and industrial software solutions in the Asia Pacific, Europe, the Middle East, Africa, and the Americas.
Reasonable growth potential with mediocre balance sheet.
Similar Companies
Market Insights

Advertisement
Community Narratives
The company that turned a verb into a global necessity and basically runs the modern internet, digital ads, smartphones, maps, and AI.
Fair Value US$300.00|6.2% undervalued
OS
Community Contributor
Flowers Foods Pays A Fair Price For Health
Fair Value US$16.12|26.0% undervalued
NV
Community Contributor
TMX Group will thrive with 33.3% profit margin and enduring market moat
Fair Value CA$49.90|3.7% overvalued
LI
Community Contributor