
Advertisement
- United Kingdom
- /
- Retail Distributors
- /
- LSE:HEAD
Should You Be Impressed By Headlam Group's (LON:HEAD) Returns on Capital?
Finding a business that has the potential to grow substantially is not easy, but it is possible if we look at a few key financial metrics. Firstly, we'd want to identify a growing return on capital employed (ROCE) and then alongside that, an ever-increasing base of capital employed. If you see this, it typically means it's a company with a great business model and plenty of profitable reinvestment opportunities. However, after investigating Headlam Group (LON:HEAD), we don't think it's current trends fit the mold of a multi-bagger.
What is Return On Capital Employed (ROCE)?
For those who don't know, ROCE is a measure of a company's yearly pre-tax profit (its return), relative to the capital employed in the business. The formula for this calculation on Headlam Group is:
Return on Capital Employed = Earnings Before Interest and Tax (EBIT) ÷ (Total Assets - Current Liabilities)
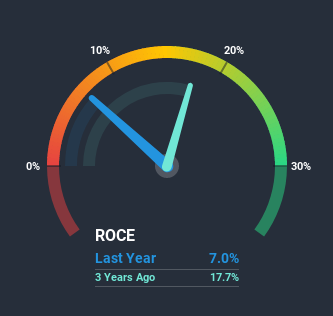
0.07 = UK£22m ÷ (UK£430m - UK£116m) (Based on the trailing twelve months to June 2020).
So, Headlam Group has an ROCE of 7.0%. In absolute terms, that's a low return and it also under-performs the Retail Distributors industry average of 17%.
See our latest analysis for Headlam Group
Above you can see how the current ROCE for Headlam Group compares to its prior returns on capital, but there's only so much you can tell from the past. If you'd like, you can check out the forecasts from the analysts covering Headlam Group here for free.
The Trend Of ROCE
When we looked at the ROCE trend at Headlam Group, we didn't gain much confidence. Over the last five years, returns on capital have decreased to 7.0% from 15% five years ago. And considering revenue has dropped while employing more capital, we'd be cautious. This could mean that the business is losing its competitive advantage or market share, because while more money is being put into ventures, it's actually producing a lower return - "less bang for their buck" per se.
On a related note, Headlam Group has decreased its current liabilities to 27% of total assets. That could partly explain why the ROCE has dropped. What's more, this can reduce some aspects of risk to the business because now the company's suppliers or short-term creditors are funding less of its operations. Since the business is basically funding more of its operations with it's own money, you could argue this has made the business less efficient at generating ROCE.
What We Can Learn From Headlam Group's ROCE
In summary, we're somewhat concerned by Headlam Group's diminishing returns on increasing amounts of capital. Investors must expect better things on the horizon though because the stock has risen 3.1% in the last five years. Regardless, we don't like the trends as they are and if they persist, we think you might find better investments elsewhere.
Headlam Group does have some risks though, and we've spotted 1 warning sign for Headlam Group that you might be interested in.
While Headlam Group may not currently earn the highest returns, we've compiled a list of companies that currently earn more than 25% return on equity. Check out this free list here.
When trading Headlam Group or any other investment, use the platform considered by many to be the Professional's Gateway to the Worlds Market, Interactive Brokers. You get the lowest-cost* trading on stocks, options, futures, forex, bonds and funds worldwide from a single integrated account. Promoted
Valuation is complex, but we're here to simplify it.
Discover if Headlam Group might be undervalued or overvalued with our detailed analysis, featuring fair value estimates, potential risks, dividends, insider trades, and its financial condition.
Access Free AnalysisThis article by Simply Wall St is general in nature. It does not constitute a recommendation to buy or sell any stock, and does not take account of your objectives, or your financial situation. We aim to bring you long-term focused analysis driven by fundamental data. Note that our analysis may not factor in the latest price-sensitive company announcements or qualitative material. Simply Wall St has no position in any stocks mentioned.
*Interactive Brokers Rated Lowest Cost Broker by StockBrokers.com Annual Online Review 2020
Have feedback on this article? Concerned about the content? Get in touch with us directly. Alternatively, email editorial-team (at) simplywallst.com.
About LSE:HEAD
Headlam Group
Engages in the sale, marketing, supply, and distribution of floorcovering and other ancillary products in the United Kingdom and Continental Europe.
Fair value with mediocre balance sheet.
Market Insights

Advertisement
Community Narratives
The "Molecular Pencil": Why Beam's Technology is Built to Win
Fair Value US$65.01|66.7% undervalued
DA
Community Contributor
The silent giant behind virtually every advanced chip powering AI, smartphones, and modern infrastructure.
Fair Value US$310.00|4.8% undervalued
OS
Community Contributor
ADP Stock: Solid Fundamentals, But AI Investments Test Its Margin Resilience
Fair Value US$387.77|34.5% undervalued
YI
Community Contributor
MINISO's fair value is projected at 26.69 with an anticipated PE ratio shift of 20x
Fair Value US$24.03|9.6% undervalued
BE
Community Contributor