
Advertisement
- United Kingdom
- /
- Retail Distributors
- /
- LSE:HEAD
Headlam Group (LON:HEAD) Could Be At Risk Of Shrinking As A Company
If you're looking at a mature business that's past the growth phase, what are some of the underlying trends that pop up? Businesses in decline often have two underlying trends, firstly, a declining return on capital employed (ROCE) and a declining base of capital employed. This indicates to us that the business is not only shrinking the size of its net assets, but its returns are falling as well. Having said that, after a brief look, Headlam Group (LON:HEAD) we aren't filled with optimism, but let's investigate further.
What Is Return On Capital Employed (ROCE)?
For those who don't know, ROCE is a measure of a company's yearly pre-tax profit (its return), relative to the capital employed in the business. Analysts use this formula to calculate it for Headlam Group:
Return on Capital Employed = Earnings Before Interest and Tax (EBIT) ÷ (Total Assets - Current Liabilities)
0.10 = UK£27m ÷ (UK£468m - UK£205m) (Based on the trailing twelve months to June 2023).
Therefore, Headlam Group has an ROCE of 10%. In isolation, that's a pretty standard return but against the Retail Distributors industry average of 14%, it's not as good.
Check out our latest analysis for Headlam Group
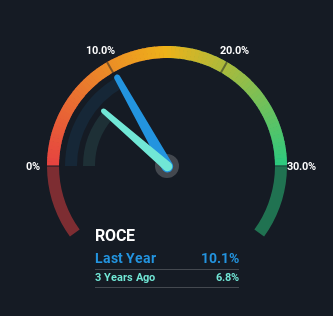
Above you can see how the current ROCE for Headlam Group compares to its prior returns on capital, but there's only so much you can tell from the past. If you're interested, you can view the analysts predictions in our free report on analyst forecasts for the company.
What The Trend Of ROCE Can Tell Us
In terms of Headlam Group's historical ROCE movements, the trend doesn't inspire confidence. About five years ago, returns on capital were 16%, however they're now substantially lower than that as we saw above. And on the capital employed front, the business is utilizing roughly the same amount of capital as it was back then. This combination can be indicative of a mature business that still has areas to deploy capital, but the returns received aren't as high due potentially to new competition or smaller margins. If these trends continue, we wouldn't expect Headlam Group to turn into a multi-bagger.
On a separate but related note, it's important to know that Headlam Group has a current liabilities to total assets ratio of 44%, which we'd consider pretty high. This effectively means that suppliers (or short-term creditors) are funding a large portion of the business, so just be aware that this can introduce some elements of risk. While it's not necessarily a bad thing, it can be beneficial if this ratio is lower.
What We Can Learn From Headlam Group's ROCE
In summary, it's unfortunate that Headlam Group is generating lower returns from the same amount of capital. Long term shareholders who've owned the stock over the last five years have experienced a 48% depreciation in their investment, so it appears the market might not like these trends either. Unless there is a shift to a more positive trajectory in these metrics, we would look elsewhere.
Headlam Group does come with some risks though, we found 2 warning signs in our investment analysis, and 1 of those doesn't sit too well with us...
For those who like to invest in solid companies, check out this free list of companies with solid balance sheets and high returns on equity.
Valuation is complex, but we're here to simplify it.
Discover if Headlam Group might be undervalued or overvalued with our detailed analysis, featuring fair value estimates, potential risks, dividends, insider trades, and its financial condition.
Access Free AnalysisHave feedback on this article? Concerned about the content? Get in touch with us directly. Alternatively, email editorial-team (at) simplywallst.com.
This article by Simply Wall St is general in nature. We provide commentary based on historical data and analyst forecasts only using an unbiased methodology and our articles are not intended to be financial advice. It does not constitute a recommendation to buy or sell any stock, and does not take account of your objectives, or your financial situation. We aim to bring you long-term focused analysis driven by fundamental data. Note that our analysis may not factor in the latest price-sensitive company announcements or qualitative material. Simply Wall St has no position in any stocks mentioned.
About LSE:HEAD
Headlam Group
Engages in the sale, marketing, supply, and distribution of floorcovering and other ancillary products in the United Kingdom and Continental Europe.
Undervalued with mediocre balance sheet.
Market Insights

Advertisement
Community Narratives
The company that turned a verb into a global necessity and basically runs the modern internet, digital ads, smartphones, maps, and AI.
Fair Value US$300.00|7.1% undervalued
OS
Community Contributor
Flowers Foods Pays A Fair Price For Health
Fair Value US$16.12|26.4% undervalued
NV
Community Contributor
TMX Group will thrive with 33.3% profit margin and enduring market moat
Fair Value CA$49.90|0.8% overvalued
LI
Community Contributor
The "Molecular Pencil": Why Beam's Technology is Built to Win
Fair Value US$65.01|65.8% undervalued
DA
Community Contributor