
Advertisement
If we want to find a potential multi-bagger, often there are underlying trends that can provide clues. Typically, we'll want to notice a trend of growing return on capital employed (ROCE) and alongside that, an expanding base of capital employed. If you see this, it typically means it's a company with a great business model and plenty of profitable reinvestment opportunities. Although, when we looked at Jaywing (LON:JWNG), it didn't seem to tick all of these boxes.
What Is Return On Capital Employed (ROCE)?
Just to clarify if you're unsure, ROCE is a metric for evaluating how much pre-tax income (in percentage terms) a company earns on the capital invested in its business. Analysts use this formula to calculate it for Jaywing:
Return on Capital Employed = Earnings Before Interest and Tax (EBIT) ÷ (Total Assets - Current Liabilities)
0.049 = UK£1.1m ÷ (UK£40m - UK£19m) (Based on the trailing twelve months to September 2021).
Therefore, Jaywing has an ROCE of 4.9%. Ultimately, that's a low return and it under-performs the Media industry average of 12%.
View our latest analysis for Jaywing
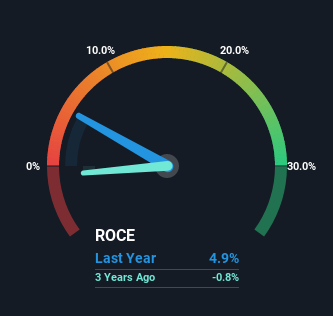
Historical performance is a great place to start when researching a stock so above you can see the gauge for Jaywing's ROCE against it's prior returns. If you want to delve into the historical earnings, revenue and cash flow of Jaywing, check out these free graphs here.
What The Trend Of ROCE Can Tell Us
Over the past five years, Jaywing's ROCE has remained relatively flat while the business is using 46% less capital than before. When a company effectively decreases its assets base, it's not usually a sign to be optimistic on that company. In addition to that, since the ROCE doesn't scream "quality" at 4.9%, it's hard to get excited about these developments.
On another note, while the change in ROCE trend might not scream for attention, it's interesting that the current liabilities have actually gone up over the last five years. This is intriguing because if current liabilities hadn't increased to 46% of total assets, this reported ROCE would probably be less than4.9% because total capital employed would be higher.The 4.9% ROCE could be even lower if current liabilities weren't 46% of total assets, because the the formula would show a larger base of total capital employed. Additionally, this high level of current liabilities isn't ideal because it means the company's suppliers (or short-term creditors) are effectively funding a large portion of the business.
The Key Takeaway
It's a shame to see that Jaywing is effectively shrinking in terms of its capital base. It seems that investors have little hope of these trends getting any better and that may have partly contributed to the stock collapsing 72% in the last five years. All in all, the inherent trends aren't typical of multi-baggers, so if that's what you're after, we think you might have more luck elsewhere.
Jaywing does come with some risks though, we found 3 warning signs in our investment analysis, and 1 of those shouldn't be ignored...
For those who like to invest in solid companies, check out this free list of companies with solid balance sheets and high returns on equity.
New: Manage All Your Stock Portfolios in One Place
We've created the ultimate portfolio companion for stock investors, and it's free.
• Connect an unlimited number of Portfolios and see your total in one currency
• Be alerted to new Warning Signs or Risks via email or mobile
• Track the Fair Value of your stocks
Have feedback on this article? Concerned about the content? Get in touch with us directly. Alternatively, email editorial-team (at) simplywallst.com.
This article by Simply Wall St is general in nature. We provide commentary based on historical data and analyst forecasts only using an unbiased methodology and our articles are not intended to be financial advice. It does not constitute a recommendation to buy or sell any stock, and does not take account of your objectives, or your financial situation. We aim to bring you long-term focused analysis driven by fundamental data. Note that our analysis may not factor in the latest price-sensitive company announcements or qualitative material. Simply Wall St has no position in any stocks mentioned.
About AIM:JWNG
Jaywing
Provides digital marketing services in the United Kingdom and Australia.
Slight and slightly overvalued.
Market Insights

Advertisement
Community Narratives
The company that turned a verb into a global necessity and basically runs the modern internet, digital ads, smartphones, maps, and AI.
Fair Value US$300.00|7.5% undervalued
OS
Community Contributor
Flowers Foods Pays A Fair Price For Health
Fair Value US$16.12|25.4% undervalued
NV
Community Contributor
TMX Group will thrive with 33.3% profit margin and enduring market moat
Fair Value CA$49.90|3.6% overvalued
LI
Community Contributor
The "Molecular Pencil": Why Beam's Technology is Built to Win
Fair Value US$65.01|65.0% undervalued
DA
Community Contributor