
Advertisement
- United Kingdom
- /
- Chemicals
- /
- LSE:SYNT
Investors Still Aren't Entirely Convinced By Synthomer plc's (LON:SYNT) Revenues Despite 27% Price Jump
Synthomer plc (LON:SYNT) shares have continued their recent momentum with a 27% gain in the last month alone. Still, the 30-day jump doesn't change the fact that longer term shareholders have seen their stock decimated by the 84% share price drop in the last twelve months.
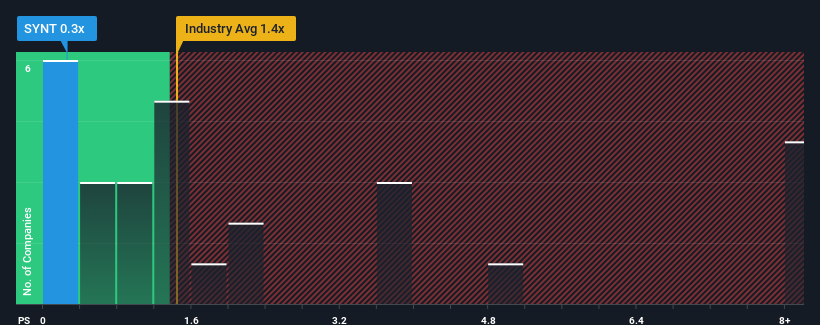
Even after such a large jump in price, Synthomer may still be sending bullish signals at the moment with its price-to-sales (or "P/S") ratio of 0.3x, since almost half of all companies in the Chemicals industry in the United Kingdom have P/S ratios greater than 1.4x and even P/S higher than 4x are not unusual. Nonetheless, we'd need to dig a little deeper to determine if there is a rational basis for the reduced P/S.
See our latest analysis for Synthomer
How Has Synthomer Performed Recently?
There hasn't been much to differentiate Synthomer's and the industry's retreating revenue lately. Perhaps the market is expecting future revenue performance to deteriorate further, which has kept the P/S suppressed. If you still like the company, you'd want its revenue trajectory to turn around before making any decisions. At the very least, you'd be hoping that revenue doesn't fall off a cliff if your plan is to pick up some stock while it's out of favour.
If you'd like to see what analysts are forecasting going forward, you should check out our free report on Synthomer.What Are Revenue Growth Metrics Telling Us About The Low P/S?
There's an inherent assumption that a company should underperform the industry for P/S ratios like Synthomer's to be considered reasonable.
Retrospectively, the last year delivered a frustrating 15% decrease to the company's top line. That put a dampener on the good run it was having over the longer-term as its three-year revenue growth is still a noteworthy 20% in total. Although it's been a bumpy ride, it's still fair to say the revenue growth recently has been mostly respectable for the company.
Turning to the outlook, the next three years should demonstrate the company's robustness, generating growth of 5.2% per annum as estimated by the eight analysts watching the company. That would be an excellent outcome when the industry is expected to decline by 1.6% per year.
With this information, we find it very odd that Synthomer is trading at a P/S lower than the industry. It looks like most investors aren't convinced at all that the company can achieve positive future growth in the face of a shrinking broader industry.
What We Can Learn From Synthomer's P/S?
The latest share price surge wasn't enough to lift Synthomer's P/S close to the industry median. Using the price-to-sales ratio alone to determine if you should sell your stock isn't sensible, however it can be a practical guide to the company's future prospects.
We've established that Synthomer currently trades on a much lower than expected P/S since its growth forecasts are potentially beating a struggling industry. There could be some major unobserved threats to revenue preventing the P/S ratio from matching the positive outlook. Amidst challenging industry conditions, a key concern is whether the company can sustain its superior revenue growth trajectory. So, the risk of a price drop looks to be subdued, but investors seem to think future revenue could see a lot of volatility.
Don't forget that there may be other risks. For instance, we've identified 3 warning signs for Synthomer that you should be aware of.
If strong companies turning a profit tickle your fancy, then you'll want to check out this free list of interesting companies that trade on a low P/E (but have proven they can grow earnings).
New: Manage All Your Stock Portfolios in One Place
We've created the ultimate portfolio companion for stock investors, and it's free.
• Connect an unlimited number of Portfolios and see your total in one currency
• Be alerted to new Warning Signs or Risks via email or mobile
• Track the Fair Value of your stocks
Have feedback on this article? Concerned about the content? Get in touch with us directly. Alternatively, email editorial-team (at) simplywallst.com.
This article by Simply Wall St is general in nature. We provide commentary based on historical data and analyst forecasts only using an unbiased methodology and our articles are not intended to be financial advice. It does not constitute a recommendation to buy or sell any stock, and does not take account of your objectives, or your financial situation. We aim to bring you long-term focused analysis driven by fundamental data. Note that our analysis may not factor in the latest price-sensitive company announcements or qualitative material. Simply Wall St has no position in any stocks mentioned.
About LSE:SYNT
Synthomer
Manufactures and supplies specialised polymers and ingredients for coatings, construction, adhesives, and health and protection sectors.
Undervalued with imperfect balance sheet.
Similar Companies
Market Insights

Advertisement
Community Narratives
MicroVision will explode future revenue by 380.37% with a vision towards success
Fair Value US$60.00|98.4% undervalued
TH
Community Contributor
The Indispensable Artery for a New North American Economy
Fair Value CA$132.87|1.3% undervalued
TI
Community Contributor