Stock Analysis
- United Kingdom
- /
- Basic Materials
- /
- LSE:BREE
Despite delivering investors losses of 8.8% over the past 3 years, Breedon Group (LON:BREE) has been growing its earnings


Breedon Group plc (LON:BREE) shareholders should be happy to see the share price up 18% in the last quarter. But that doesn't change the fact that the returns over the last three years have been less than pleasing. After all, the share price is down 14% in the last three years, significantly under-performing the market.
While the stock has risen 4.4% in the past week but long term shareholders are still in the red, let's see what the fundamentals can tell us.
Check out our latest analysis for Breedon Group
To paraphrase Benjamin Graham: Over the short term the market is a voting machine, but over the long term it's a weighing machine. By comparing earnings per share (EPS) and share price changes over time, we can get a feel for how investor attitudes to a company have morphed over time.
Although the share price is down over three years, Breedon Group actually managed to grow EPS by 49% per year in that time. This is quite a puzzle, and suggests there might be something temporarily buoying the share price. Alternatively, growth expectations may have been unreasonable in the past.
Since the change in EPS doesn't seem to correlate with the change in share price, it's worth taking a look at other metrics.
Revenue is actually up 18% over the three years, so the share price drop doesn't seem to hinge on revenue, either. This analysis is just perfunctory, but it might be worth researching Breedon Group more closely, as sometimes stocks fall unfairly. This could present an opportunity.
The image below shows how earnings and revenue have tracked over time (if you click on the image you can see greater detail).
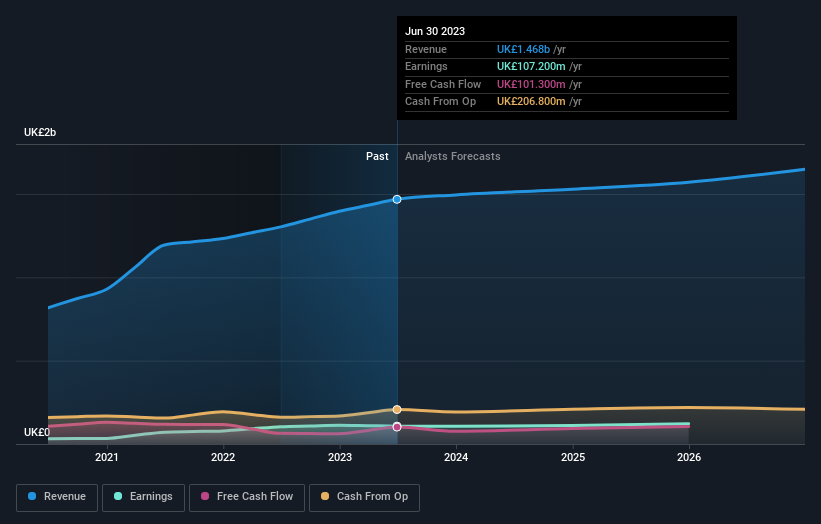
Breedon Group is a well known stock, with plenty of analyst coverage, suggesting some visibility into future growth. If you are thinking of buying or selling Breedon Group stock, you should check out this free report showing analyst consensus estimates for future profits.
What About Dividends?
It is important to consider the total shareholder return, as well as the share price return, for any given stock. The TSR is a return calculation that accounts for the value of cash dividends (assuming that any dividend received was reinvested) and the calculated value of any discounted capital raisings and spin-offs. So for companies that pay a generous dividend, the TSR is often a lot higher than the share price return. As it happens, Breedon Group's TSR for the last 3 years was -8.8%, which exceeds the share price return mentioned earlier. And there's no prize for guessing that the dividend payments largely explain the divergence!
A Different Perspective
We're pleased to report that Breedon Group shareholders have received a total shareholder return of 14% over one year. That's including the dividend. Since the one-year TSR is better than the five-year TSR (the latter coming in at 3% per year), it would seem that the stock's performance has improved in recent times. Someone with an optimistic perspective could view the recent improvement in TSR as indicating that the business itself is getting better with time. It's always interesting to track share price performance over the longer term. But to understand Breedon Group better, we need to consider many other factors. Take risks, for example - Breedon Group has 1 warning sign we think you should be aware of.
Of course Breedon Group may not be the best stock to buy. So you may wish to see this free collection of growth stocks.
Please note, the market returns quoted in this article reflect the market weighted average returns of stocks that currently trade on British exchanges.
Valuation is complex, but we're helping make it simple.
Find out whether Breedon Group is potentially over or undervalued by checking out our comprehensive analysis, which includes fair value estimates, risks and warnings, dividends, insider transactions and financial health.
View the Free AnalysisHave feedback on this article? Concerned about the content? Get in touch with us directly. Alternatively, email editorial-team (at) simplywallst.com.
This article by Simply Wall St is general in nature. We provide commentary based on historical data and analyst forecasts only using an unbiased methodology and our articles are not intended to be financial advice. It does not constitute a recommendation to buy or sell any stock, and does not take account of your objectives, or your financial situation. We aim to bring you long-term focused analysis driven by fundamental data. Note that our analysis may not factor in the latest price-sensitive company announcements or qualitative material. Simply Wall St has no position in any stocks mentioned.
About LSE:BREE
Breedon Group
Engages in the quarrying, manufacture, and sale of construction materials and building products primarily in the United Kingdom, Republic of Ireland, and internationally.
Flawless balance sheet and undervalued.
