Stock Analysis
- United Kingdom
- /
- Metals and Mining
- /
- AIM:PAF
Pan African Resources' (LON:PAF) 14% CAGR outpaced the company's earnings growth over the same five-year period


Stock pickers are generally looking for stocks that will outperform the broader market. And while active stock picking involves risks (and requires diversification) it can also provide excess returns. To wit, the Pan African Resources share price has climbed 61% in five years, easily topping the market return of 0.4% (ignoring dividends).
After a strong gain in the past week, it's worth seeing if longer term returns have been driven by improving fundamentals.
See our latest analysis for Pan African Resources
While markets are a powerful pricing mechanism, share prices reflect investor sentiment, not just underlying business performance. One imperfect but simple way to consider how the market perception of a company has shifted is to compare the change in the earnings per share (EPS) with the share price movement.
Over half a decade, Pan African Resources managed to grow its earnings per share at 30% a year. The EPS growth is more impressive than the yearly share price gain of 10% over the same period. So one could conclude that the broader market has become more cautious towards the stock. This cautious sentiment is reflected in its (fairly low) P/E ratio of 6.90.
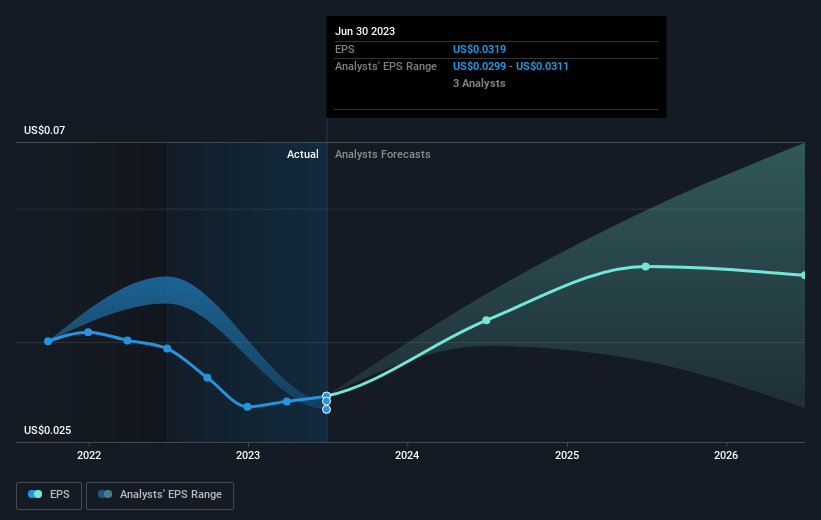
The graphic below depicts how EPS has changed over time (unveil the exact values by clicking on the image).
We like that insiders have been buying shares in the last twelve months. Having said that, most people consider earnings and revenue growth trends to be a more meaningful guide to the business. Dive deeper into the earnings by checking this interactive graph of Pan African Resources' earnings, revenue and cash flow.
What About Dividends?
As well as measuring the share price return, investors should also consider the total shareholder return (TSR). The TSR incorporates the value of any spin-offs or discounted capital raisings, along with any dividends, based on the assumption that the dividends are reinvested. It's fair to say that the TSR gives a more complete picture for stocks that pay a dividend. As it happens, Pan African Resources' TSR for the last 5 years was 93%, which exceeds the share price return mentioned earlier. This is largely a result of its dividend payments!
A Different Perspective
Pan African Resources shareholders are down 2.1% over twelve months (even including dividends), which isn't far from the market return of -2.1%. The silver lining is that longer term investors would have made a total return of 14% per year over half a decade. If the stock price has been impacted by changing sentiment, rather than deteriorating business conditions, it could spell opportunity. While it is well worth considering the different impacts that market conditions can have on the share price, there are other factors that are even more important. Case in point: We've spotted 1 warning sign for Pan African Resources you should be aware of.
Pan African Resources is not the only stock that insiders are buying. For those who like to find winning investments this free list of growing companies with recent insider purchasing, could be just the ticket.
Please note, the market returns quoted in this article reflect the market weighted average returns of stocks that currently trade on British exchanges.
Valuation is complex, but we're helping make it simple.
Find out whether Pan African Resources is potentially over or undervalued by checking out our comprehensive analysis, which includes fair value estimates, risks and warnings, dividends, insider transactions and financial health.
View the Free AnalysisHave feedback on this article? Concerned about the content? Get in touch with us directly. Alternatively, email editorial-team (at) simplywallst.com.
This article by Simply Wall St is general in nature. We provide commentary based on historical data and analyst forecasts only using an unbiased methodology and our articles are not intended to be financial advice. It does not constitute a recommendation to buy or sell any stock, and does not take account of your objectives, or your financial situation. We aim to bring you long-term focused analysis driven by fundamental data. Note that our analysis may not factor in the latest price-sensitive company announcements or qualitative material. Simply Wall St has no position in any stocks mentioned.
About AIM:PAF
Pan African Resources
Engages in the mining, extraction, production, and sale of gold in South Africa.
Very undervalued with outstanding track record.
